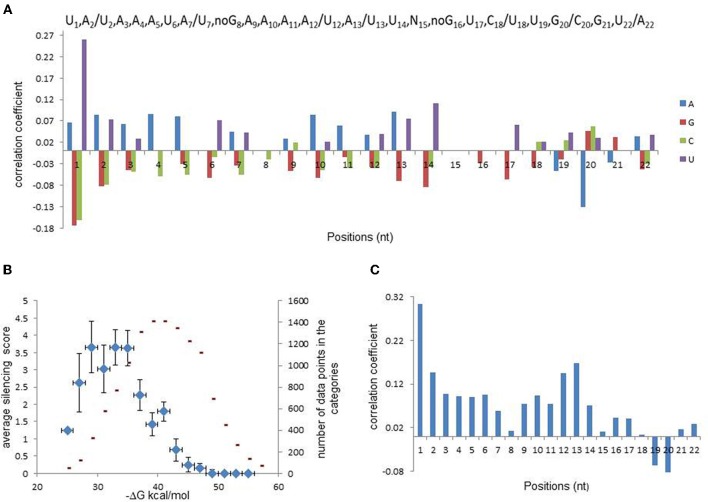
Figure 1.
Analysis of relationships between silencing efficiency and features of shRNA guide strand. (A) Correlations between shRNA silencing efficiency score (ln) and nucleotide presence at each sequence position (bottom panel). Position-dependent consensus for efficient miR30-based shRNAs (top panel). Two nucleotides were included in the consensus at the same position if correlation coefficients between silencing efficiency and their presence were similar. (B) Data categorization according to shRNA duplex stability that shows relationship between this stability and shRNA silencing efficiency. For creation of the scatter-plots, data-points were separated into bines according to total or regional duplex stabilities and average silencing was evaluated for each bin. shRNA silencing efficiency values are shown as blue diamonds and numbers of data-point in each bin are shown in red. Regional or total duplex stability was estimated as total Gibbs free energy, (ΔG), and shRNA silencing efficiency was determined from fluorescence. (C) Correlation between silencing efficiency and shRNA local dinucleotide duplex stabilities.

