
Figure A1.
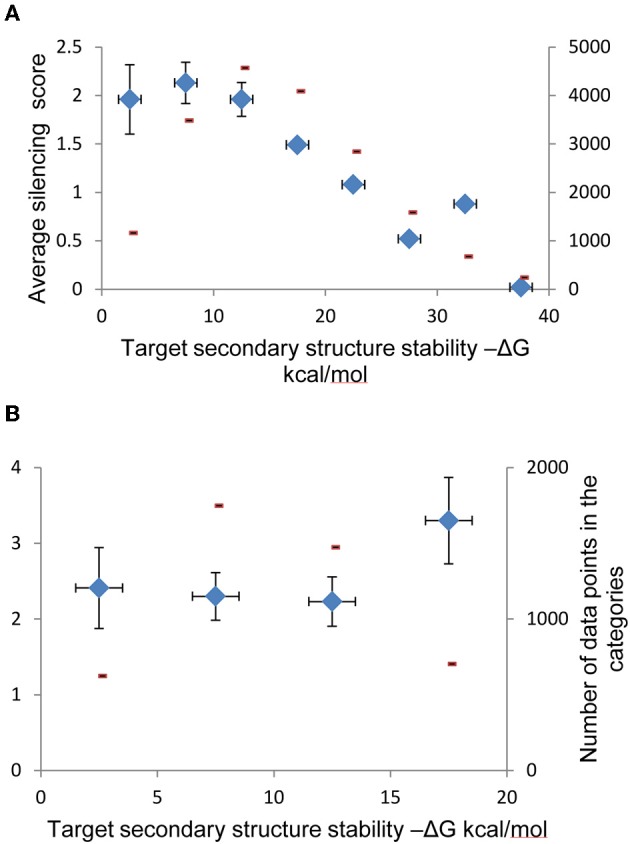
Categorization of shRNAs according to secondary structure stability of their targets and guide strands. (A) Data categorization according to target RNA secondary structure stability that shows relationship between this stability and shRNA silencing efficiency in complete dataset. (B) Data categorization according to target RNA secondary structure stability that shows relationship between this stability and silencing efficiency among shRNAs with duplex stability (ΔG) between −25 and −35 kcal/mol. Data points were separated into bines according to secondary structure stabilities and average silencing efficiency was evaluated for each bin. Average values for shRNA silencing efficiency are shown in each scatter plot (blue diamonds), along with the numbers of data points in each bin (red marks).