
Figure A2.
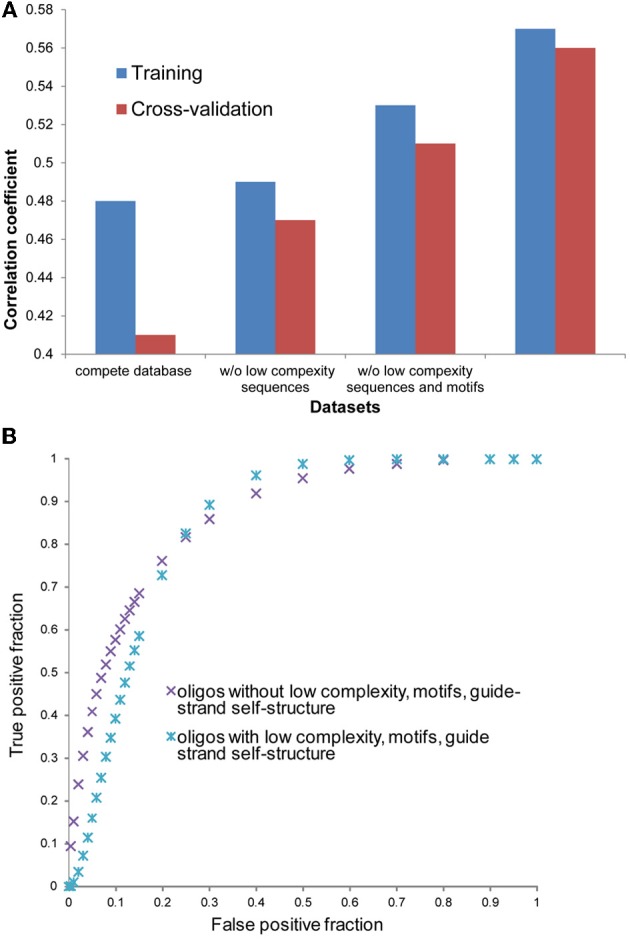
Correlation analysis with different subsets of oligonucleotides where three different procedures of filtration were applied. (A) Correlation coefficients for the regression models with the same input parameters, but different variants of datasets for data training. The first dataset variant includes complete database, the second and third datasets includes data without low complexity sequences and without low complexity sequences and motifs, as described in the “Results,” correspondingly. The fourth dataset includes data from the third dataset from which all data points that corresponded to miRNA with guided strand able to form stable secondary structure (ΔG < −2 kcal/mol) were removed. (B) Cross validation ROC curves for fourth and control datasets. Control dataset contains all the rest of the data which includes sequences with low complexity, motifs and stable secondary structure.