
Fig. 1.
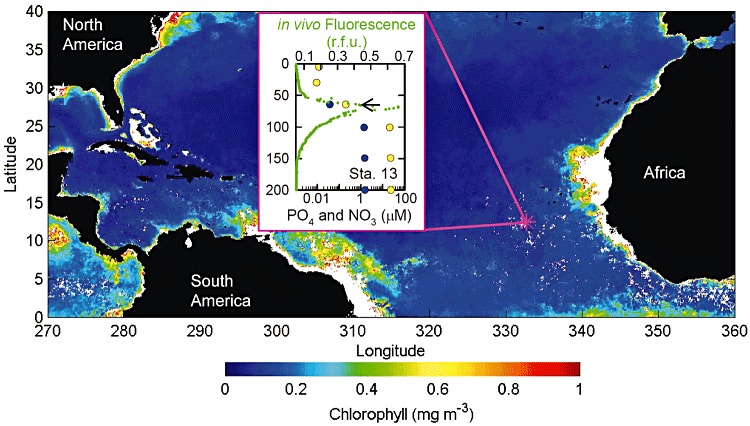
Atlantic Ocean site (pink star) from which a natural population of Bathycoccus was sorted and sequenced. Ocean colour represents Aqua MODIS Atlantic Ocean chlorophyll concentration data (mg m−3) from 1 May to 5 September 2006, spanning the period of sample collection; black indicates land and white indicates missing data. Lower chlorophyll concentrations reflect lower phytoplankton biomass and occurs in regions with low nutrient availability. (Inset) phosphate (blue) and nitrate plus nitrite (yellow) concentrations as well as in vivo fluorescence from chlorophyll (green) at the sort site. The Y-axis represents depth (m). Arrow indicates the depth from which Bathycoccus was sorted.