
Fig. 3.
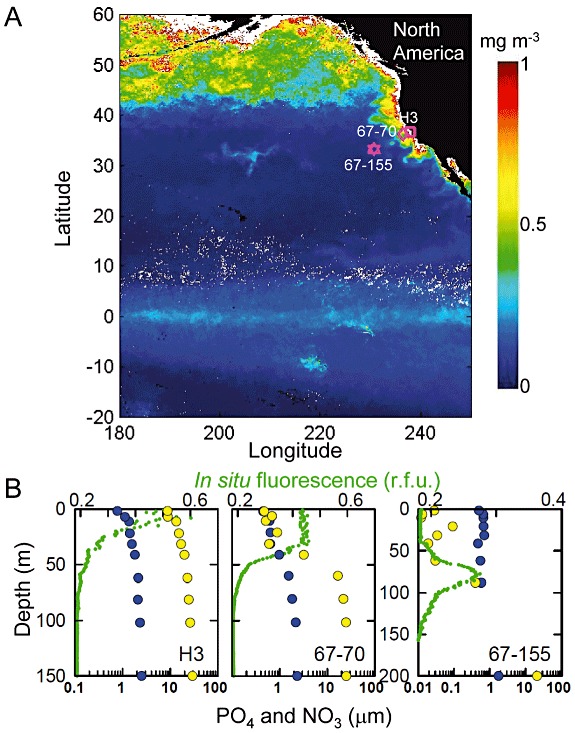
A. Sample sites for Pacific Ocean metagenomes and satellite inferred chlorophyll a concentrations (mg m−3) over a period spanning the cruise (14 September–8 November 2007). Black indicates land, white missing data, pink symbols indicate sample sites. B. Phosphate (blue) and nitrate (yellow) concentrations as well as in vivo fluorescence (green) at sample collection sites.