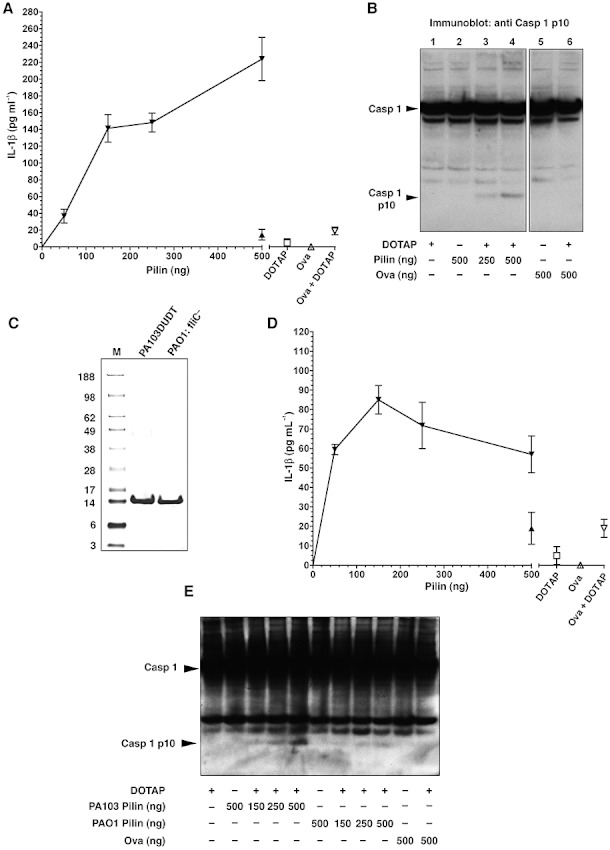
Fig. 2.

Dose–response curves of pilin activation of the inflammasome. A. Secreted IL-1β from BMDMs (corrected for release of unprocessed IL-1β) in response to indicated amounts of pilin in the presence of DOTAP (inverted filled triangles). Result with pilin alone at 500 ng shown as filled triangle. Values are means of three independent determinations; error bars are ± SEM. Repeated on two further occasions with similar results. Values for DOTAP alone, Ova and Ova plus DOTAP are shown to the right. Differences between doses of pilin are statistically significant (One-way ANOVA, P < 0.0001), with a significant increase with dose (P < 0.0001). B. Immunoblot with anti p10 caspase-1 of cell extracts from BMDMs treated as shown. Arrows indicate the unprocessed caspase-1 (Casp 1) and the p10 processed subunit (Casp 10 p10). These bands are absent in infected cells from caspase-1 knockout animals [(Lindestam Arlehamn et al., 2010) and data not shown]. Representative of three separate experiments. C. SDS-PAGE analysis of material purified after agitation of indicated bacterial suspension cultures and stained with colloidal Coomassie Blue. Molecular weight markers (kDa) are shown to the left. Representative of three separate experiments. D as A, but using pilin purified from PAO1:fliC-. Differences between doses of pilin are statistically significant (One-way ANOVA, P = 0.0001), with a significant increase with dose (P = 0.004). E. Immunoblot with anti p10 caspase-1 of cell extracts from BMDMs treated as shown. Arrows indicate the unprocessed caspase-1 (Casp 1) and the p10 processed subunit (Casp 10 p10). Experiment repeated with similar results.
