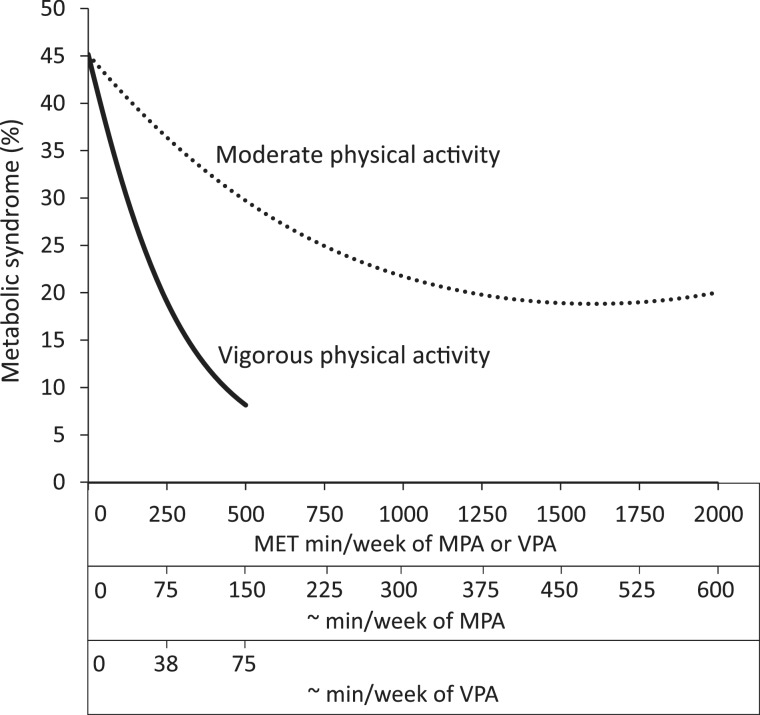
Figure 1.
Estimated prevalence of the MetS according to MET min/week of MPA and VPA. Prevalence estimates were adjusted for age, sex, ethnicity, socio-economic status, smoking, alcohol, dietary fat, saturated fat and sodium. Minutes per week of MPA and VPA are approximations and were determined by dividing the corresponding MET min/week values by 3.33 and 6.67, respectively. Prevalence estimates were plotted from MPA and VPA MET min/week values of 0 to values that corresponded to the 98th percentile of the sample

