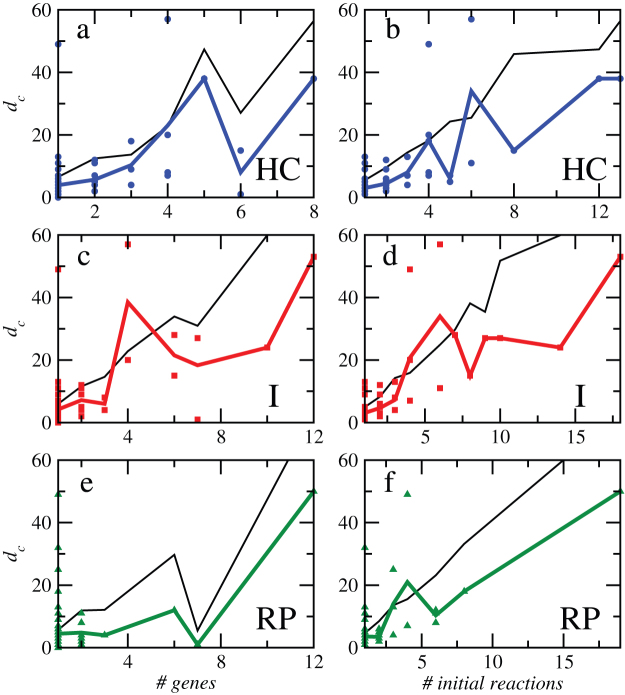
Figure 4. Damages as a function of the number of metabolic genes and reaction failures in gene co-expression cluster knockouts.
Clusters are defined according to three different methods: Hierarchical Clustering (HC), Infomap (I), and Recursive Percolation (RP), see Materials and Methods. Results are compared with damages produced in randomized versions of the metabolic networks in order to discount structural effects. In each case, the solid black curve is the average over 100 realizations.

