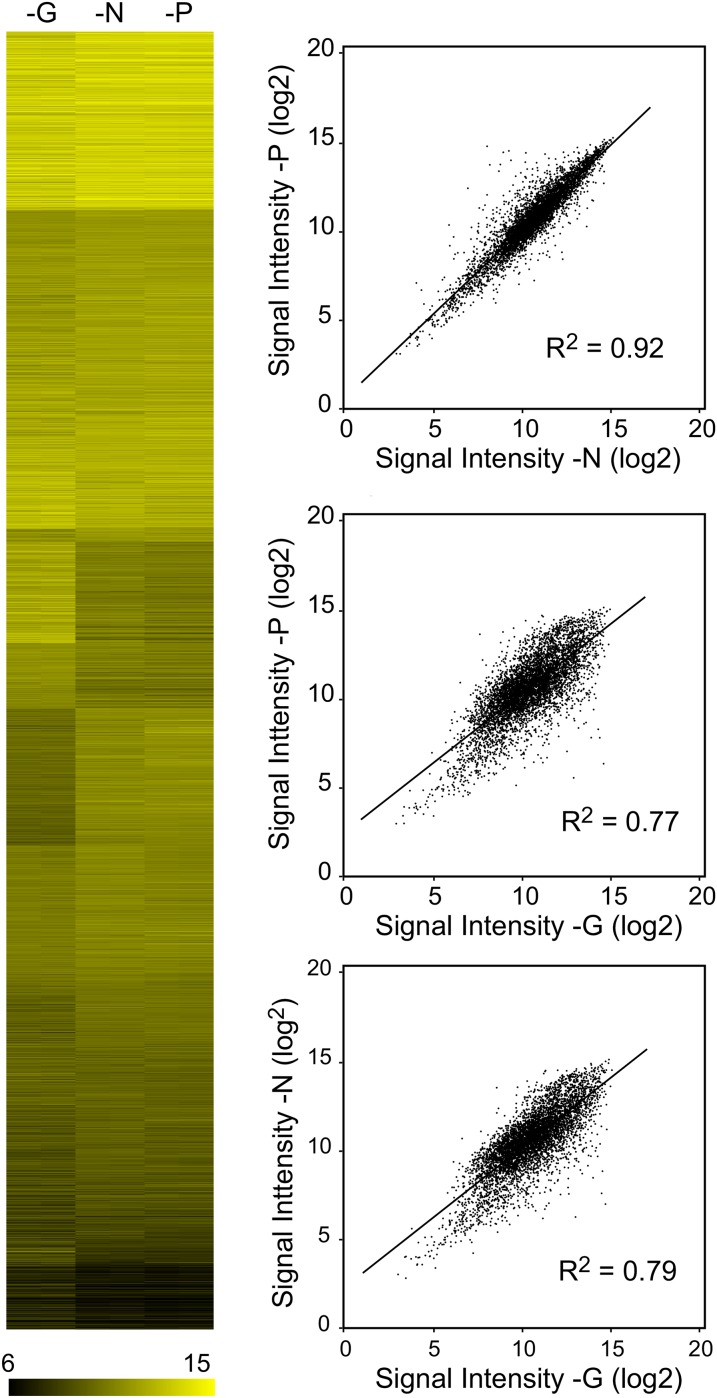
Figure 1 .
Comparing transcript levels in G-, N-, or P-depleted cells. Wild-type (S288C) cultures were transferred into S medium lacking G, N, or P and were cultured until growth was arrested, and then samples were collected for Affymetrix microarray analysis as described in Materials and Methods. (A) Heat map plotting normalized log2-transformed hybridization intensity data for G-, N-, and P-limited samples arranged by k-means clustering. Independent biological replicate samples are shown as side-by-side columns; the values are so similar between replicates that these columns cannot be readily distinguished by eye in most cases. (B) For each transcript, average intensity data from (A) is plotted such that the expression level in one nutrient condition is on the X-axis, and intensity value in another condition is on the Y-axis. G vs. N starvation yielded a Pearson correlation of 0.79; G vs. P starvation a correlation of 0.77; and N compared with P, a correlation of 0.92.

