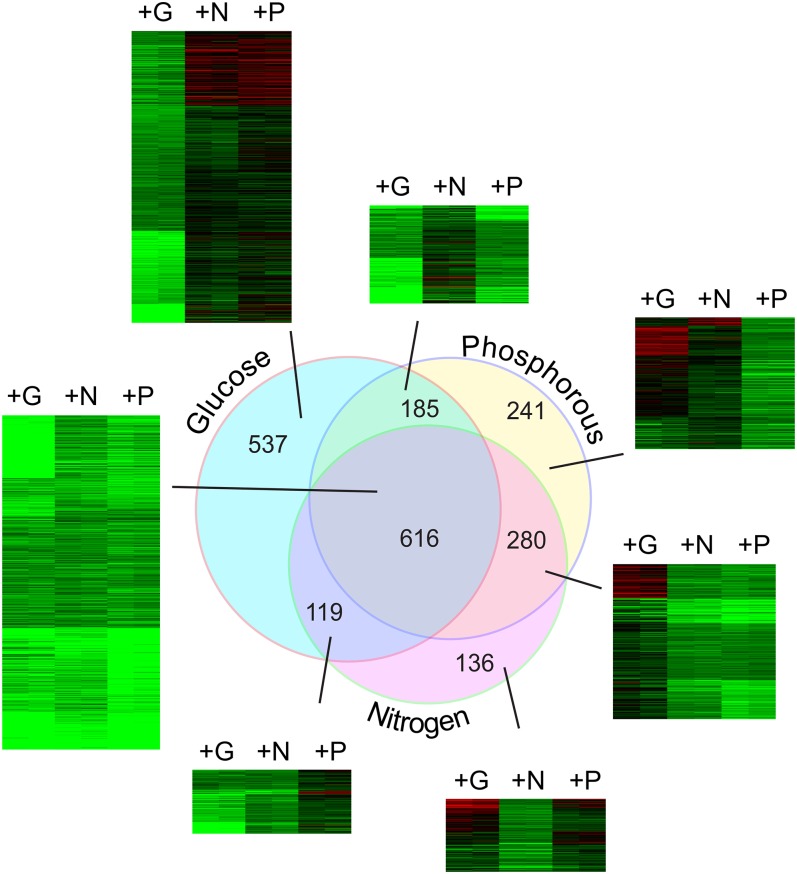
Figure 4 .
Genes repressed by G, N, and P repletion. Microarray data from Figure 2 was used to identify transcripts reduced by at least 2-fold by G, N or P repletion compared with quiescence levels as described in Materials and Methods. The Venn diagram shows the intersections between the sets of genes repressed at least 2-fold by each nutrient. This intersection of three sets produced seven different groups, and a heat map of fold-change responses is shown for each of these seven sets. Independent biological replicate samples are shown as side-by-side columns, and the transcripts are arranged by k-means clustering. The number of individual transcripts in each set is shown in the figure, and the transcripts are listed for each set in Table S2.

