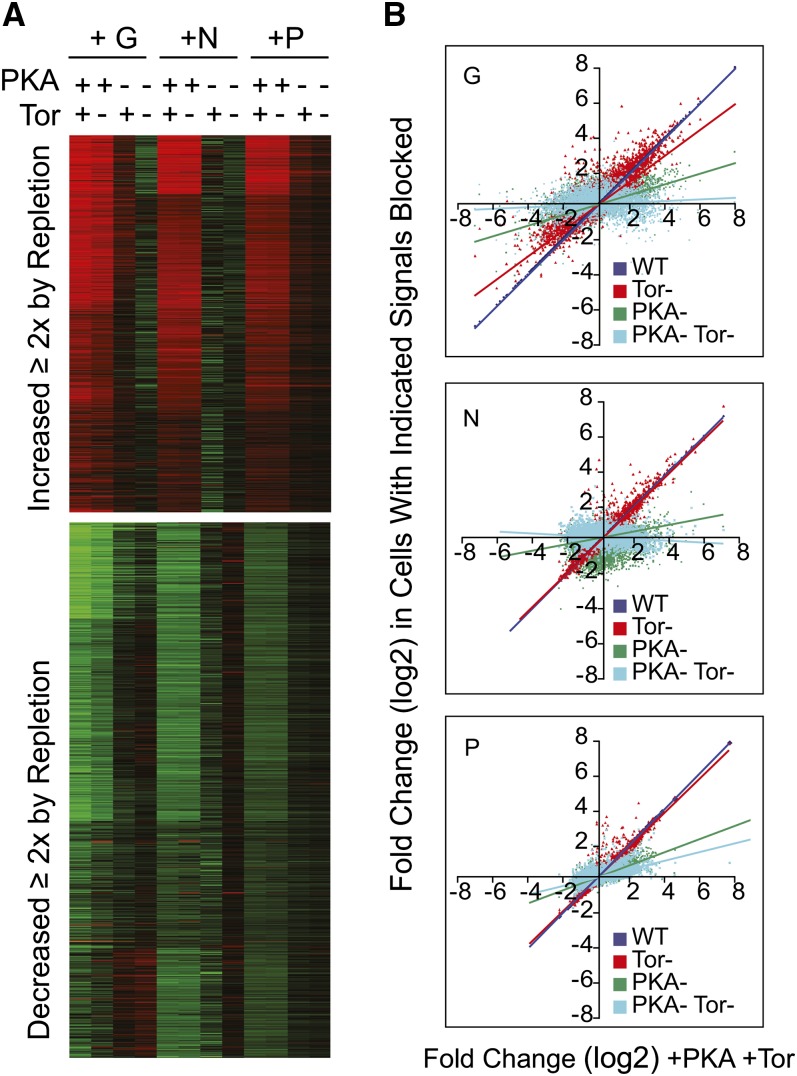
Figure 5 .
The effect of PKA and TOR signaling in the transcriptional response to G, N, and P. Cells carrying a cyr1Δ mutation (TC41) were starved for G, N, or P until growth arrested, and cAMP was removed as described in Materials and Methods. Samples for microarray analysis were taken at the starved state and 60 min after repletion of each missing nutrient. In some samples, rapamycin (200 nM) was added during repletion to block the TOR pathway, and in some samples, cAMP (1 mM) was omitted from the repletion medium to block the cAMP/PKA pathway. (A) Heat map showing the average log2 fold change for each of the 501 (top panel) or 616 genes (bottom panel) identified in Figures 3 and 4 as induced or repressed in all three nutrient-repletion conditions. Heat maps were k-means clustered. Red indicates induction relative to the starved state; green indicates repression; and black, no change. The + symbols indicate active and the − symbols indicate blocked pathways, produced by adding and subtracting rapamycin and cAMP. (B) For each transcript, the average fold change in expression induced by nutrient repletion in the cyr1Δ mutant +cAMP and −rapamycin is plotted on the X-axis (+PKA, +TOR). Responses under different conditions are shown on the Y-axis as follows: red is fold change produced in cyr1Δ cells treated with rapamycin (−TOR); green is fold change produced in cyr1Δ cells without cAMP (−PKA); light blue is fold change produced by nutrients in cyr1Δ cells without cAMP and with rapamycin (−PKA-TOR); and dark blue is fold change produced by nutrients in the isogenic wild-type cells (HR125). The slope of each line indicates the severity of signaling inhibition across the genome relative to the +PKA, +TOR samples.

