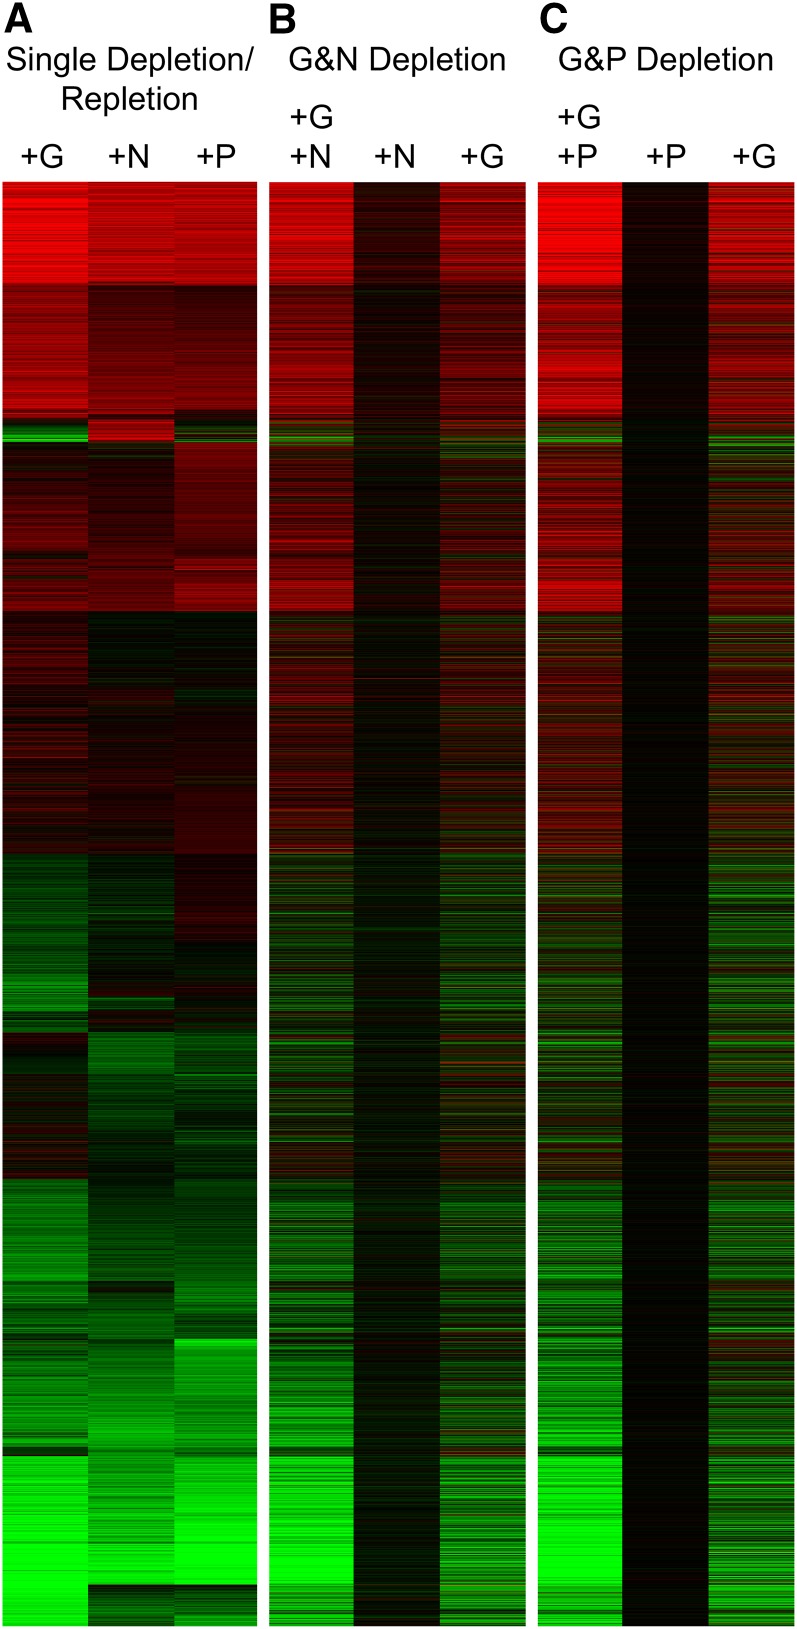
Figure 8 .
Cross talk between nutrient signals. S288C cells were starved for the indicated nutrients and repleted with either a single nutrient or both of the limiting nutrients as described in Materials and Methods. (A) As a point of reference, the results for depletion and repletion of single nutrients (G, N, and P) are shown, and the k-means clustering pattern of this set of single nutrient repletions was used to order the other two panels. (B) Cells limited for both G and N were repleted with G, N, or both, and then cells were collected for microarray analysis 60 min after nutrient addition. Duplicate experiments were conducted, and the heat map shows the average log2 fold-change ratio induced by the nutrients for each transcript. Red indicates induction relative to the starved state; green indicates repression; and black, no change. (C) Samples were depleted for both G and P and repleted as indicated.

