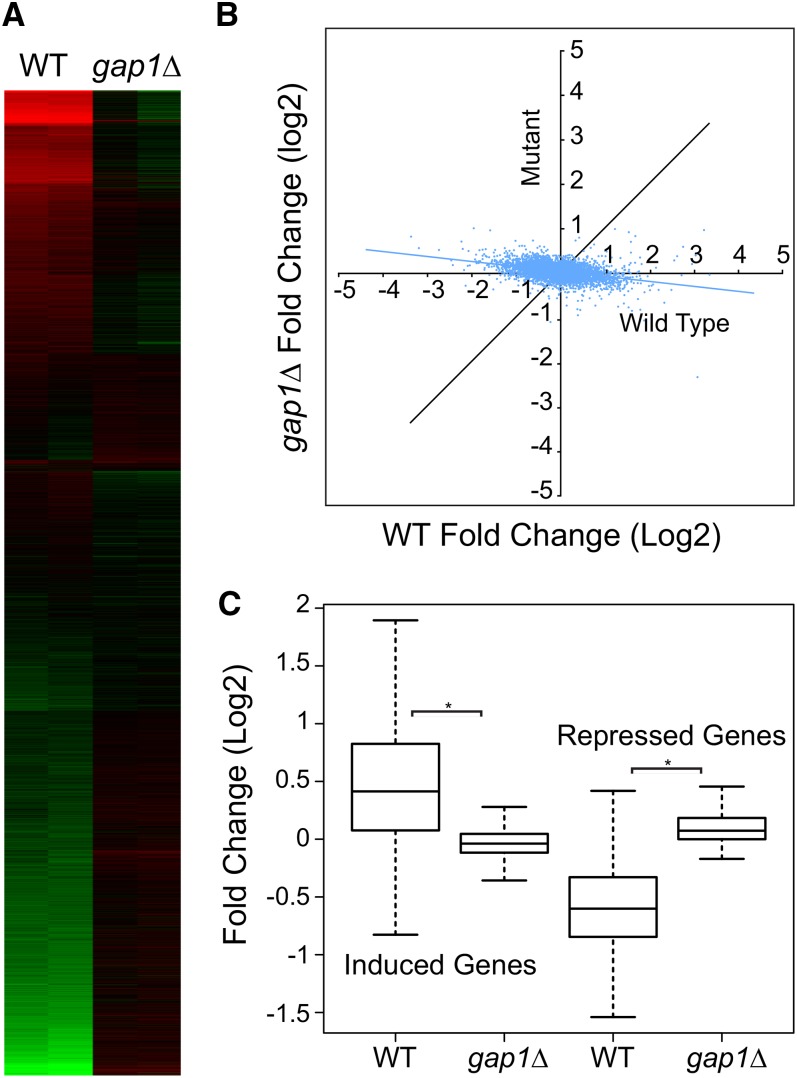
Figure 9 .
Effect of GAP1 deletion on the transcriptional response to N. Wild-type (BY4742) or the isogenic gap1Δ cells were starved for N as in Figure 1 and then challenged with 10 mM L-citrulline. Samples for microarray analysis were collected at the starved state and 60 min after L-citrulline repletion. (A) The heat map shows the log2 fold-change results for each transcript of duplicate independent experiments in parallel columns: red indicates induction relative to the starved state, and green indicates repression. The k-means method was used to arrange gene clusters. (B) Dot plot in which the average log2 response to L-citrulline is plotted for each transcript. The fold-change response in wild-type cells is plotted on the X-axis, and the response in the gap1Δ mutant is shown on the Y-axis. (C) Box plots summarizing the expression of the 501 induced or 616 repressed genes from Figures 3 and 4 in either the wild-type or the gap1Δ strains. The black band in the box indicates the median; the upper box limit, the 75th percentile; the lower box limit, the 25th percentile; and each whisker, the minimum and maximum value within 1.5× of the interquartile range, respectively. The asterisk indicates a significant difference (P < 0.05).

