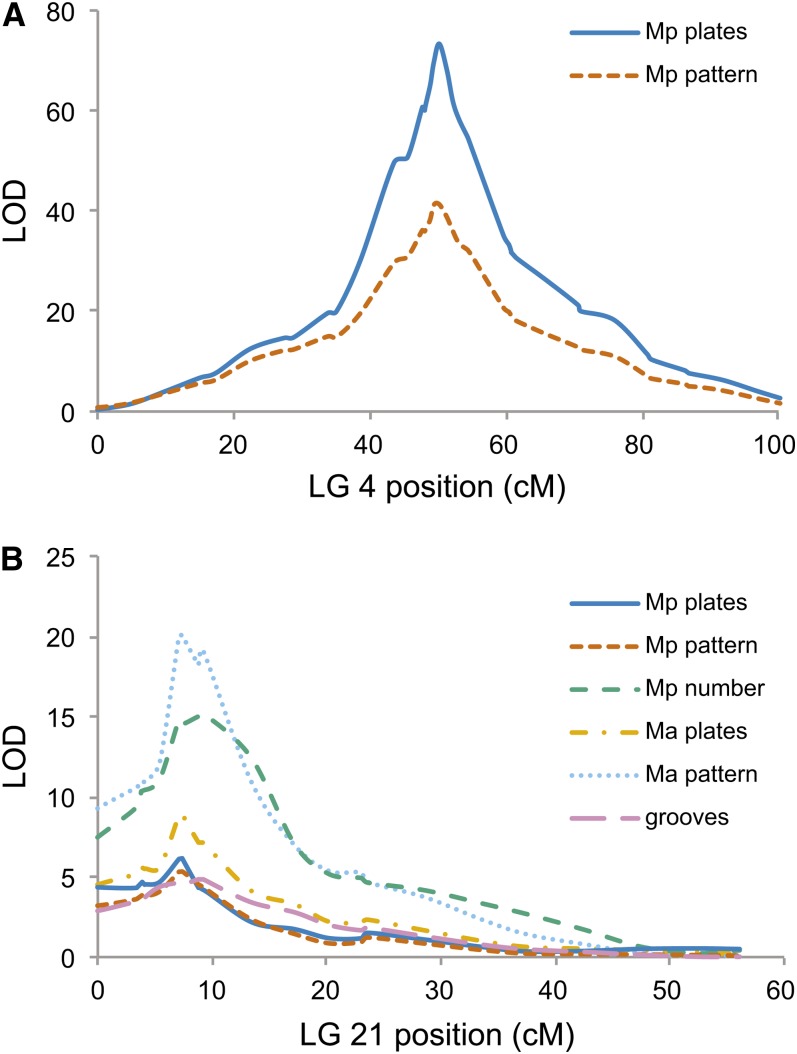
Figure 5.
Significant QTL for grooves, neuromast number, neuromast pattern, and lateral plate number map to LG 4 and LG 21. For each trait, LOD scores are plotted relative to genetic map position (cM) on LG 4 (A) and LG 21 (B). The names of the genetic markers and their genetic map positions are provided in Table S1 and Table S2.

