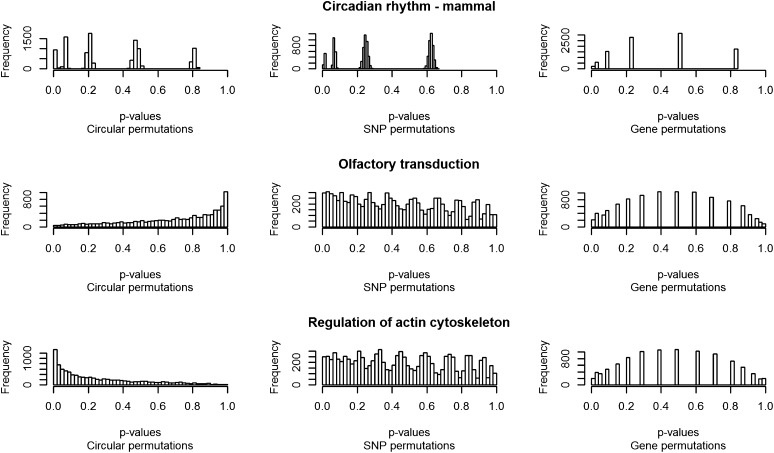
Figure 3 .
Permutation distributions. Three pathways and their hypergeometric P value permuted distributions for the glucose trait. Each individual plot represents the outcome of the 10,000 permuted hypergeometric tests per pathway. These three pathways were selected because they represent the three trends observed across all the analyzed pathways. The left column represents the circular genomic permutation P value distribution; the central column represents the SNP-level random permutation P value distribution, and the right column represents the gene-level random permutation P value distribution.

