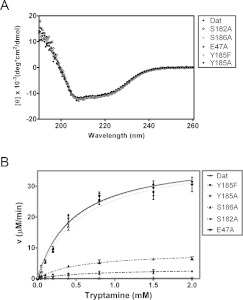
Figure 5. CD spectra and enzymatic activities of Dat and five variants each mutated at a catalytic-site position.
(A) The far-UV CD spectra of Dat, E47A, S182A, Y185F/Y185A and S186A. (B) Plots of velocity as a function of substrate concentration used to determine the enzyme activities of Dat and its mutants. The enzyme kinetic data were fitted to the Michaelis–Menten equation in non-linear regression using GraphPad Prism. The order of Dat mutants in the box reflects the enzyme activity from high activity to low activity.

