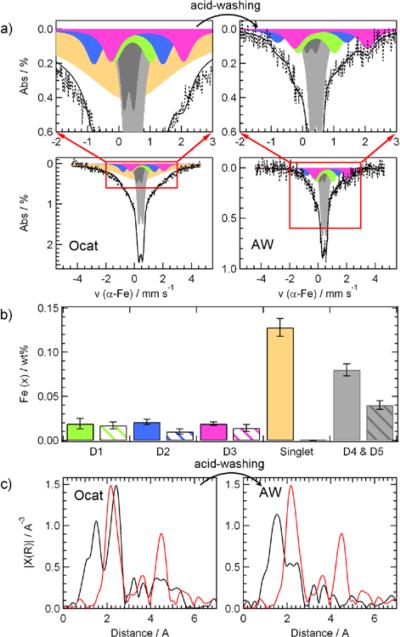
Figure 5.
Effects of acid-washing on the Fe-species in the catalyst containing 0.27 wt% Fe. (A) displays the Mossbauer spectra of the original catalyst (Ocat) and its acid-washed derivative (AW); the full bars in (B) correspond to the iron concentrations of each Fe-species in the Mössbauer spectra of the Ocat, while the patterned bars represent the concentrations in the AW sample; (C) shows the corresponding EXAFS spectra of the original catalyst Ocat and its acid-washed derivative AW. The red lines in both EXAFS spectra are that of an iron foil. The Fe content of the AW catalyst is 0.09 wt%.

