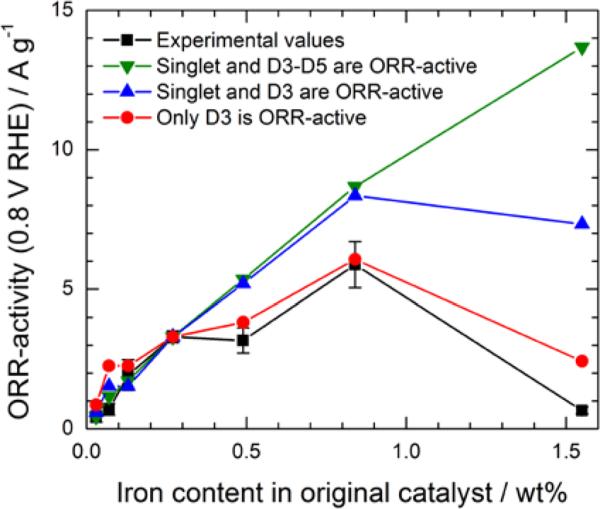
Figure 8.

Comparison between experimental ORR activities reproduced from Figure 4a (black squares) and calculated ORR activities according to three hypotheses: (1) iron nitride nanoparticles (D4 and D5), the singlet and D3 (FeN2+2…Nprot/C composite sites) are all ORR active (green triangles); (2) the singlet and D3 are both active (blue triangles); (3) only D3-sites are ORR active (red circles).
