
Figure 2.
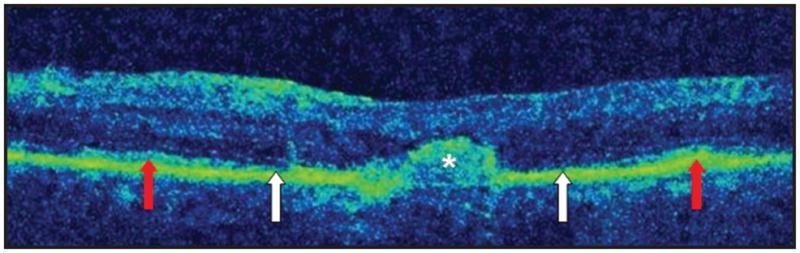
High-definition spectral-domain optical coherence tomography raster image of patient at presentation. Image shows subretinal deposit (asterisk) with an adjacent area of retinal pigment epithelium loss. Areas of outer retinal atrophy (white arrows) are shown, flanked by areas of relatively normal outer retina (red arrows).