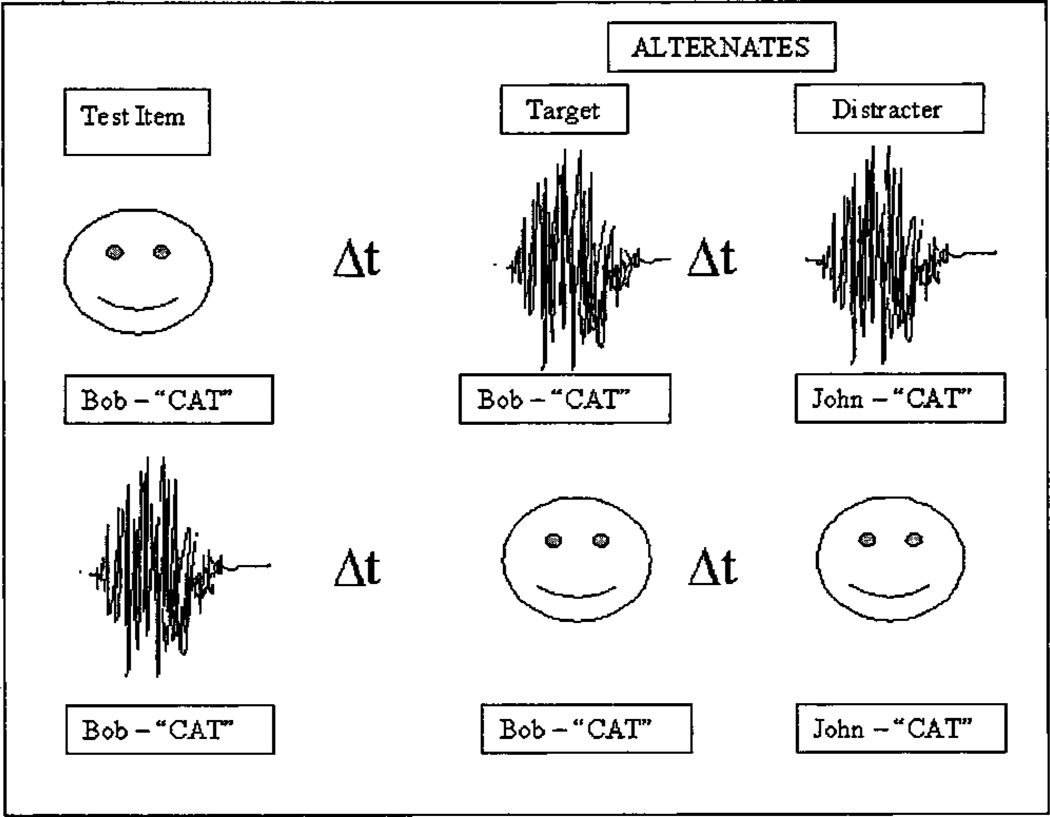
FIG. 3.
Schematic of the cross-modal matching task. The top row illustrates the task in the “V-to-A order.” The bottom row illustrates the task in the “A-to V order.” Faces denote stimuli that are presented visual-alone. Waveforms denote stimuli that are presented auditory-alone. Δt is always 500 ms.

