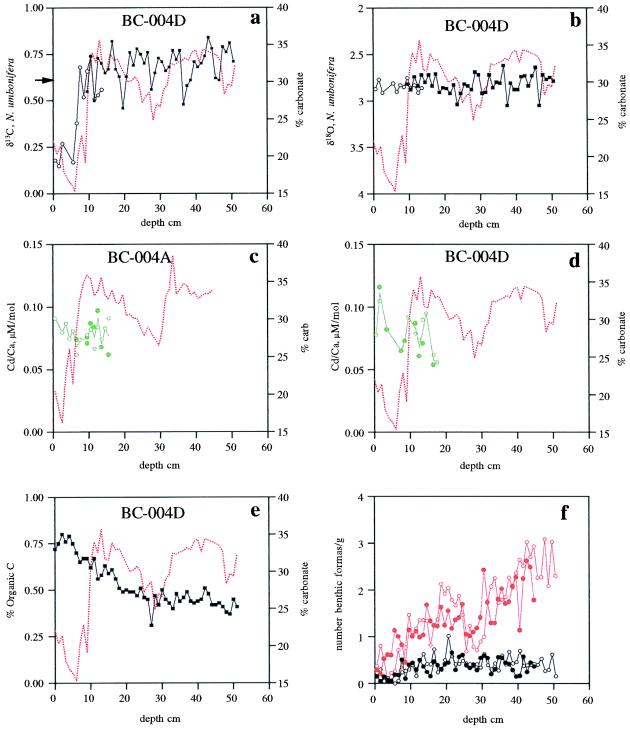
Figure 2.
New paleochemical and sedimentological data for the past ≈3 ka at Bermuda Rise core HU89038 BC-004. For a–e, the dashed red curve is the calcium carbonate content at the respective sub cores of BC-004 (after 20). In a and b, δ13C and δ18O (respectively), filled data points are analyses on a VG 903 mass spectrometer and open points were measured on a Finnigan 251. It was necessary to switch to the more sensitive Finnigan 251 for the stable isotope analyses in the LIA samples where the benthic foram abundance was minimal (because of higher clay and silt fluxes). In a, the measured bottom water value for δ13C of total CO2 on the Bermuda Rise is shown by an arrow on the y axis (0.66 ‰). Cd/Ca data on N. umbonifera (open symbols) and Cibicidoides (filled symbols) are shown for the subcores in c and d, with the average value for each depth shown as a solid line. e shows the percent organic carbon in BC-004D, and f presents the abundance of Cibicidoides (filled black circles, BC-004A; open black circles, BC-004D) and the abundance of N. umbonifera (filled red circles, BC-004A; open red circles, BC-004D).

