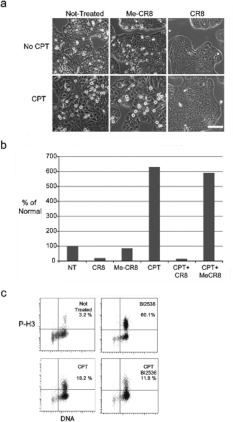
Figure 5. Cell cycle inhibitors block the entry into mitosis of cells treated with CPT.
(a) Cells were either not treated (upper row) or treated with CPT (lower row). At 24 h after treatment, cells were either treated with methyl-CR8 (Me-CR8) or with CR8 or no further treatment (NT) and cultivated for a further 24 h. Scale bar, 200 μm. (b) The number of MDCs collected by mechanical shake-off were counted at 48 h under each treatment condition and presented as percentages relative to non-treated cells (NT). (c) Cells were either not treated or treated with 100 nM BI2536 for 24 h, 25 nM CPT for 48 h, or co-treated with 25 nM CPT for 48 h with 100 nM BI2536 for the last 24 h. Samples were analysed by flow cytometry for DNA content and for phospho-Ser10 histone H3 signals. The percentage of cells positive for phospho-Ser10 histone H3 (P-H3) is listed in the upper right-hand quadrant.

