. 2011 Sep;16(9):1149–1158.
Copyright: © Journal of Research in Medical Sciences
This is an open-access article distributed under the terms of the Creative Commons Attribution-Noncommercial-Share Alike 3.0 Unported, which permits unrestricted use, distribution, and reproduction in any medium, provided the original work is properly cited.
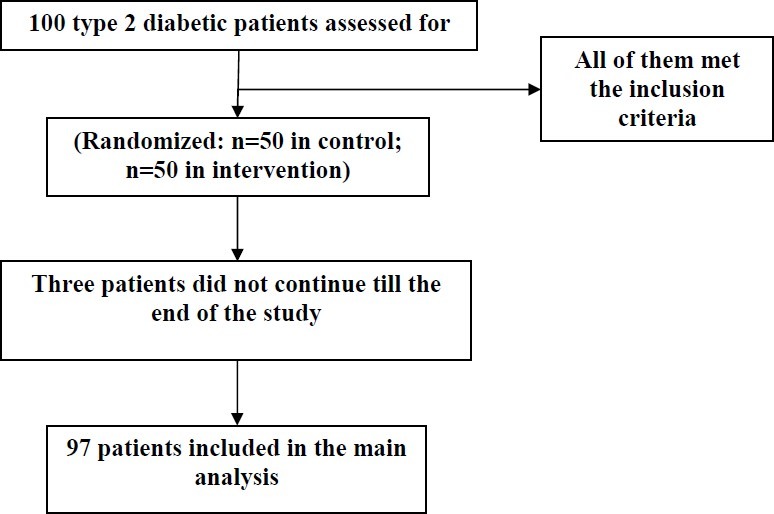
Figure 1.

Patients diagram during the present study.
