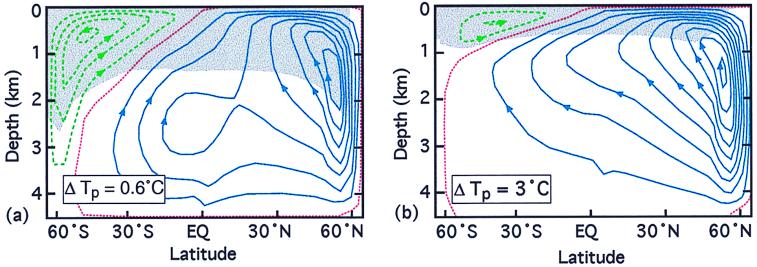
Figure 1.
THC streamlines (each contour denoting 2 Sverdrups) from an idealized three-dimensional model spanning both hemispheres of a single ocean basin. The blue solid lines mark the “northern” THC cell (sinking in NH) while the green, dashed lines mark the “southern” THC cell (sinking in SH). The red dotted lines demark the boundary between the cells. Shading represents temperatures higher than the minimum in the SH. The pole-to-pole imposed surface temperature difference is denoted by ΔTp. (a) Small asymmetries in surface forcing cause strongly asymmetric flows. (b) As the northern cell increases, the southern cell weakens by almost the same amount, leaving their sum nearly constant (adapted from ref. 9).

