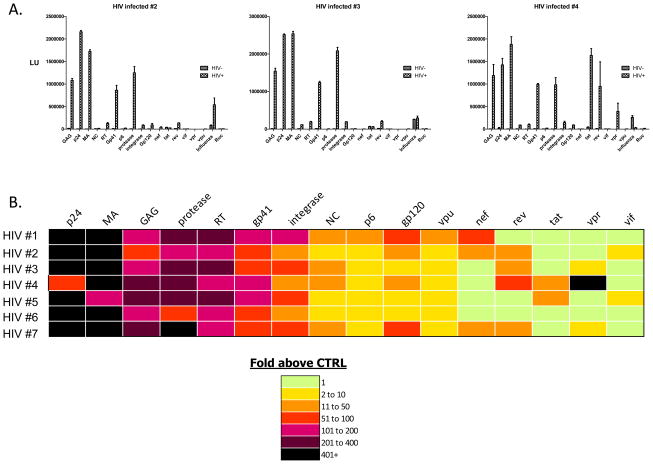
Fig. 3.
Representative LIPS arrays profiling anti-HIV antibodies against the whole proteome of HIV. A. Shown are raw LU data for 3 representative uninfected and HIV-infected patients probed with the HIV arrays. Antibody titers in LU are plotted on the Y-axis for each antigen. B. Heatmap analysis of anti-HIV profiles in 7 HIV-infected patients. The titer values expressed as the fold greater than the uninfected controls were color-coded from green to dark purple. Each row represents the result for a single patient.

