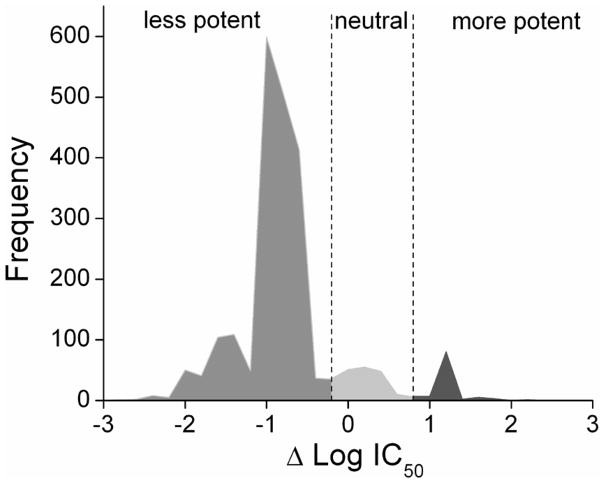
Figure 2. Difference in potency distribution between lucPpy and Ultra-Glo luciferase formulations.
Active compounds from the previous lucPpy qHTS and the Ultra-Glo luciferase qHTS were compared and the ΔLogAC50 values were calculated. Negative ΔLogAC50 values represent compounds that were less potent in the Ultra-Glo luciferase compared to the lucPpy qHTS, while positive ΔLogAC50 values represent compounds that were more potent in the Ultra-Glo luciferase compared to the lucPpy qHTS.

