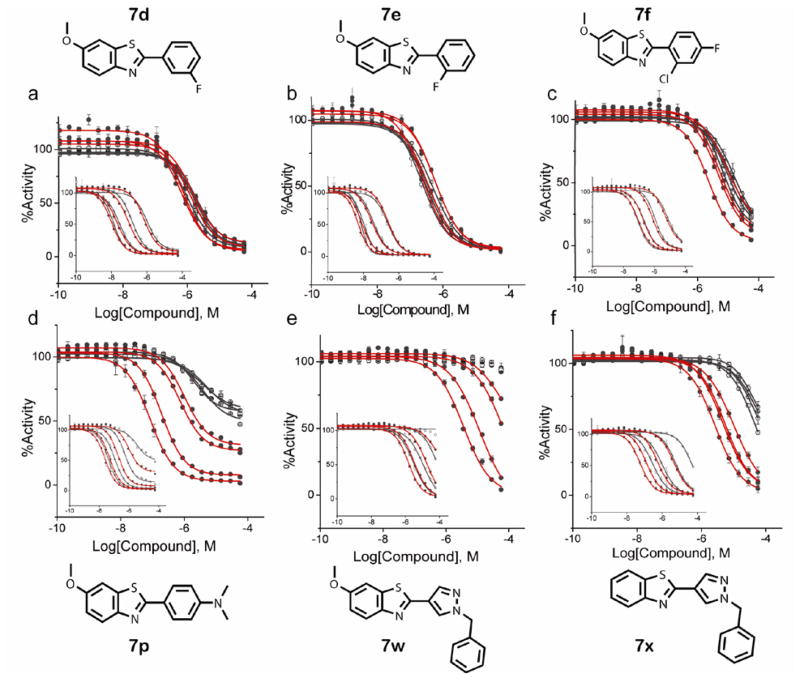
Figure 4. Comparison lucPpy and Ultra-Glo luciferase against 2-phenylbenzothiazole luciferase inhibitors at multiple substrate concentrations.
Graphs of ATP variation or luciferin variation (inset) are shown. Luciferin or ATP was varied at 0.25 μM, 2 μM, 25 μM and 250 μM resulting in four sets of CRCs. In each case the constant substrate was present at 250 μM. The lucPpy data is shown as solid circles with red CRC fits and the Ultra-Glo luciferase is shown as open circles with black fitted lines. The structures of the inhibitors assayed are also shown. The top graphs show compounds with luciferin competitive behavior against both lucPpy and Ultra-Glo luciferase, while the bottom graphs demonstrate inhibitors which maintain potency at high ATP or luciferin concentrations for lucPpy but not Ultra-Glo luciferase.

