FIGURE 3.
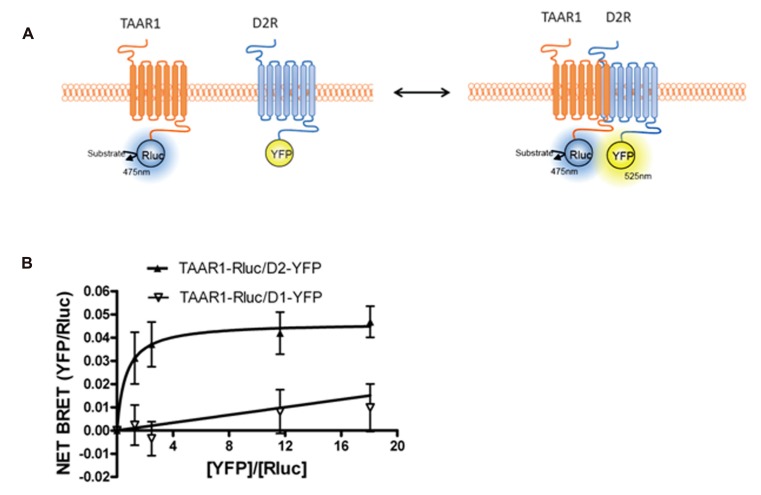
Bioluminescence resonance energy transfer (BRET) monitoring of TAAR1 and D2R heterodimerization. (A) Cartoon of postulated molecular events during heterodimerization of GPCRs causing related BRET signal. TAAR1 is tagged with Rluc and D2R is tagged with YFP to monitor intermolecular interaction between these two receptors. (B) BRET titration curve of physical interaction between TAAR1–Rluc and D2R–YFP. A fixed amount of TAAR1–Rluc and increasing amount of D2R–YFP were co-expressed in the same cells. BRET was measured 20 min after the addition of the substrate, coelenterazine h. To test specificity of BRET signal between TAAR1 and D2R, BRET was also measured between TAAR1–Rluc and increasing amount of D1R–YFP. The hyperbolic shape of the curve indicates that TAAR1–Rluc and D2R–YFP form a constitutive heterodimer when co-expressed in the same cells. A linear increase in the BRET signal is observed between TAAR1–Rluc and D1–YFP indicating a non-specific, bystander BRET between these receptors.

