
Fig 3.
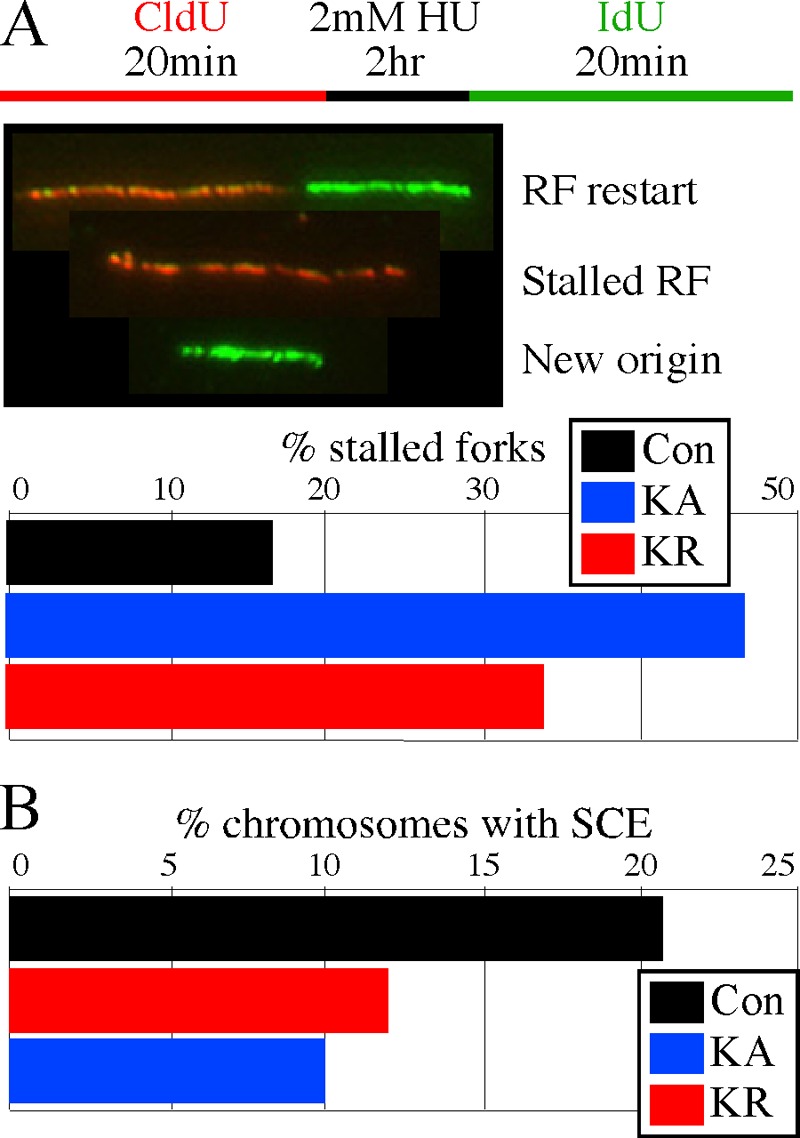
Replication fork restart and sister chromatid exchanges. Control is unaltered AB2.2 cells. (A) Microfiber analysis to observe replication fork restart. The experimental design is shown at the top, and DNA fibers shown in the middle illustrate replication forks (RFs) that have restarted (red-black-green), stalled (red), or initiated from a new origin (green). Shown is a quantification of the percentage of fibers that were stalled after exposure to 2 mM HU for 2 h (bottom). The numbers of fibers observed that were stalled, restarted, or from a new origin, respectively, are as follows: control, 69, 351, and 5; HsRAD51K133A, 267, 288, and 19; and HsRAD51K133R, 264, 515, and 9. (B) Graph depicting the percentage of chromosomes observed to undergo spontaneous SCEs. The total number of SCEs and total number of chromosomes, respectively, observed are as follows: control, 197 and 945; HsRAD51K133A, 234 and 1,927; and HsRAD51K133R, 153 and 1,572.