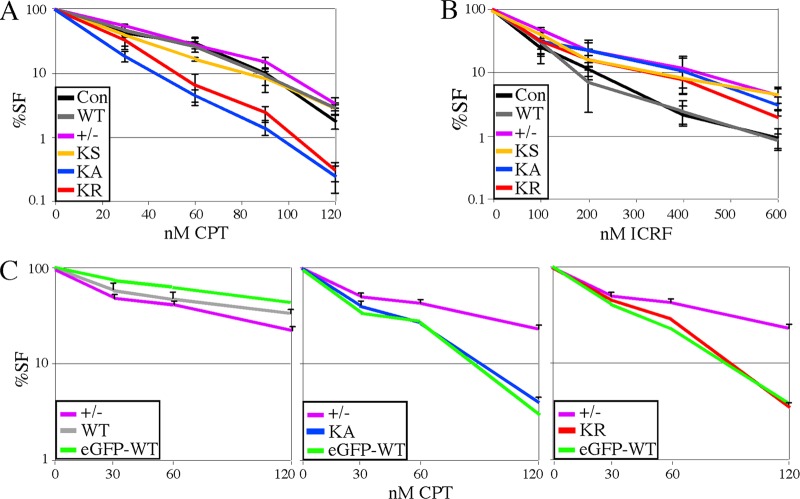
Fig 4.
Dose response to topoisomerase inhibitors. In Lex1 cells, the dose response to camptothecin (CPT) (A) and ICRF-193 (B) were determined using a cell survival assay that counts both replicating and nonreplicating cells (39). Lex1 unaltered cells are the control. These graphs represent the average of three experiments. (C) Comparison of eGFP-tagged and untagged proteins using a colony-forming assay for AB2.2 cells that express WT (left), KA (middle), or KR (right). Shown is the average of three experiments. The control (+/−) is the same for all three graphs and can be used as a standard for comparison.

