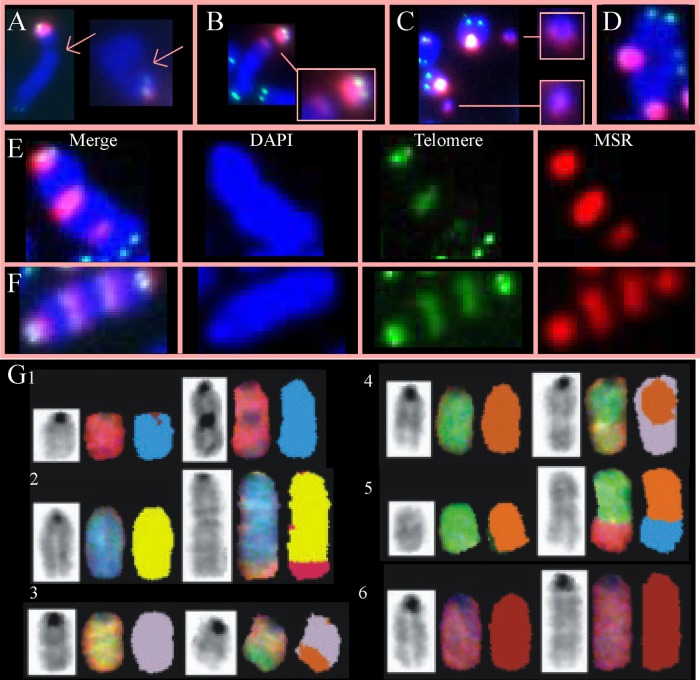
Fig 6.
Evaluation of metaphase spreads (MPS) for spontaneous chromosomal abnormalities in Lex1 (A to C) and AB2.2 (D to G) cells. (A) Chromatid breaks in the long arm (blue). (B) Isochromatid breaks (left) in the pericentromere (red). (C) Fragments containing the pericentromere (red). (D) Radial. (E) An EPT-1. (F) An EPT-2. (G) SKY analysis. (Row 1) der(11)fusion. This is an EPT. (Row 2) Duplication 1 der(1)t(1:6). This is likely an EPT. (Row 3) der(3)t(3:5). (Row 4) der(5)t(5:3). (Row 5) der(8)t(8:14). This may be an EPT but is difficult to discern. (Row 6) Duplication 2.

