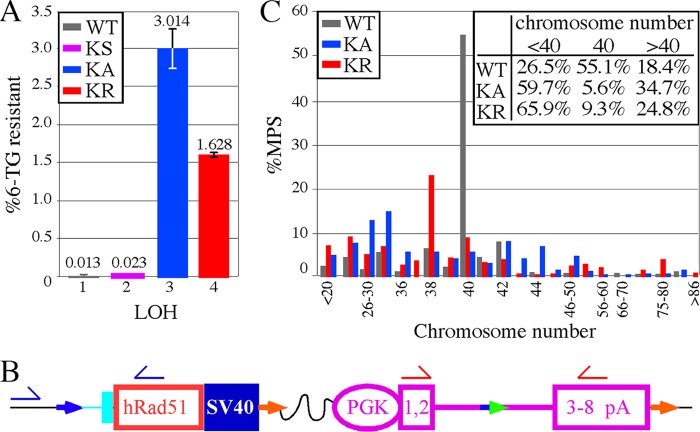
Fig 7.
Analysis of LOH in AB2.2 cells that express HsRAD51 (WT, K133A, and K133R). (A) The percentage of colonies that survived in 6-TG. The numbers of 6-TG-resistant colonies from three replica plates are as follows: KS, 12, 14, and 13; HsRAD51WT, 16, 12, and 10; HsRAD51K133A, 2,038, 2,457, and 2,558; and HsRAD51K133R, 911, 951, and 951. The numbers of colonies that grew without selection are as follows: KS, 55,800; HsRAD51WT, 95,800; HsRAD51K133A, 78,000; and HsRAD51K133R, 57,600. Statistics (t test): 1 versus 2, 0.062; 1 versus 3, 0.0047; 1 versus 4, 0.0002; 2 versus 3, 0.0046; 2 versus 4, 0.0002; and 3 versus 4, 0.0167. (B) Location of primers for PCR analysis to detect the presence/absence of the HsRAD51 cDNA (blue half-arrows) and miniHPRT (red half-arrows). The total numbers of 6-TG resistant colonies observed are as follows: WT, 8; KS, 7; KA, 10; and KR, 10. (C) The percentage of metaphase spreads that contain the number of chromosomes shown on the x axis. The inset shows the total percentages of metaphase spreads with <40, 40, and >40 chromosomes, showing there is more chromosome loss than gain. The total numbers of metaphase spreads observed are as follows: WT, 147; KA, 144; and KR, 129.

