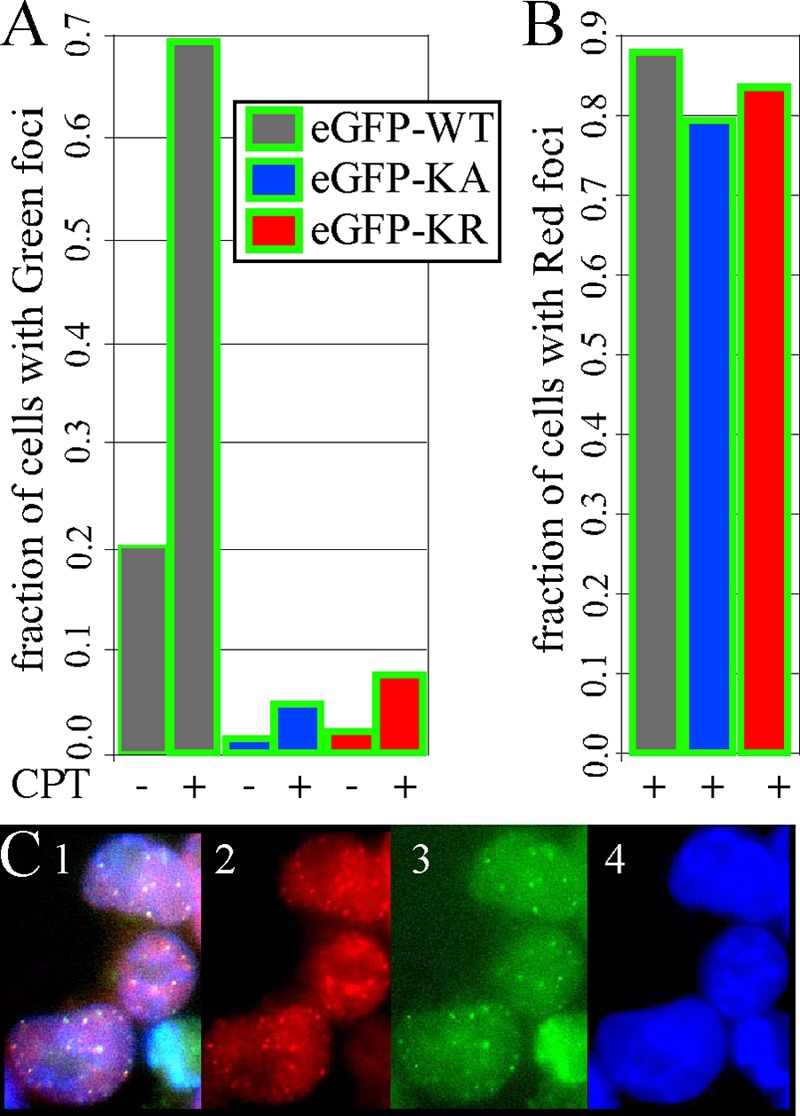
Fig 9.

Spontaneous and CPT-induced foci in AB2.2 cells. (A) Graph showing the fraction of cells that exhibit green foci before and after 3 h of exposure to 1 μM CPT. The total numbers of cells observed before and after CPT, respectively, are as follows: eGFP-WT, 162 and 154; eGFP-KA, 112 and 87; and eGFP-KR, 199 and 253. (B) Graph showing the fraction of cells that exhibit red foci after 3 h of exposure to 1 μM CPT. The same cells were observed as for the green foci shown in panel A. (C) Cells expressing eGFP-HsRAD51WT after 3 h of exposure to 1 μM CPT. Panel 1, merge; panel 2, anti-HsRAD51 antibody; panel 3, green fluorescence; panel 4, DAPI.
