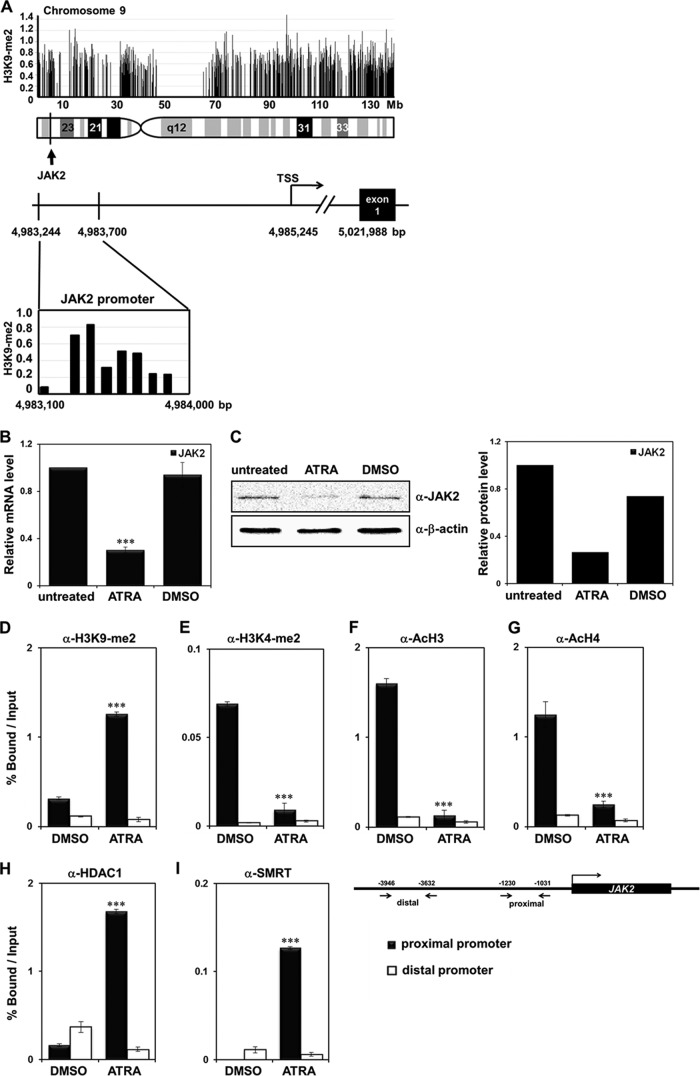
Fig 1.
Identification of JAK2 as an H3K9-me2 target gene in ATRA-treated HL-60 cells. (A) An expanded view of the JAK2 locus from chromosome 9 is shown in the genuine 5′-3′ orientation. The locus of JAK2 TSS sequences used in the ChIP-chip analysis is shown with H3K9-me2 levels. (B) HL-60 cells were treated with 1 μM ATRA or DMSO and harvested 72 h later. JAK2 mRNA levels were measured using real-time PCR. The results are the average of three independent experiments, and error bars represent ± standard deviation (SD). ***, P < 0.001 compared with the value for the untreated control. (C) Western blot analysis of JAK2 expression levels in ATRA-treated HL-60 cells. JAK2 expression was quantified and normalized to the level of β-actin. (D to I) Recruitment levels of H3K9-me2, H3K4-me2, acetyl-H3, acetyl-H4, HDAC1, and SMRT in the JAK2 proximal and distal promoter regions during ATRA-mediated differentiation of HL-60 cells using the chromatin immunoprecipitation (ChIP) assay. HL-60 cells were treated with 1 μM ATRA or DMSO for 48 h. Cross-linked samples were immunoprecipitated with the indicated antibodies. The precipitated DNA fragments were subjected to real-time PCR. The results are averages of three independent experiments, and the error bars represent ± SD ***, P < 0.001 compared with the value for the DMSO control.

