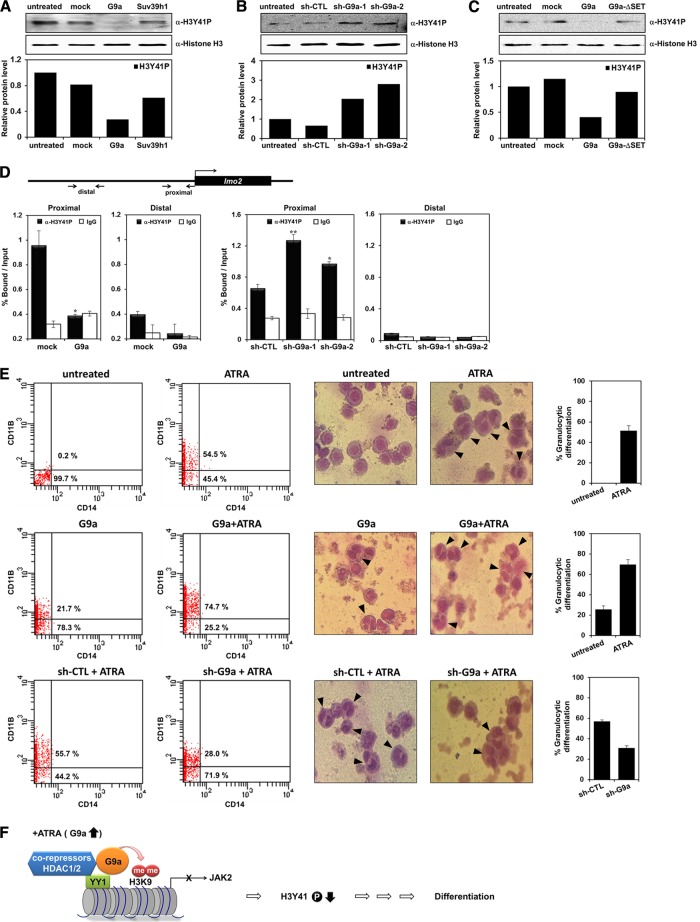
Fig 6.
G9a decreases H3Y41 phosphorylation. (A to C) Histone extracts were prepared from transfected K562 cells. The H3Y41 phosphorylation level was confirmed by Western blot analysis with anti-H3Y41P antibody. The histone H3 was used as a loading control. Western blot bands were quantified and normalized to the levels of histone H3. (D) Schematic diagram of primer pairs of lmo2 proximal and distal promoter regions in the ChIP assay and real-time PCR analysis (top). K562 cells were transfected with pEGFP-C1, pEGFP-G9a, pLKO.1, or two G9a shRNAs. ChIP analysis was performed using anti-H3Y41P antibody and confirmed by real-time PCR. H3Y41 phosphorylation levels at the lmo2 promoter regions were normalized by input. Results are shown as means ± SD (n = 3). * and **, P < 0.05 and P < 0.01 compared with the value for each control. (E) HL-60 cells were transfected with G9a or G9a shRNAs and treated with 1 μΜ ATRA for 72 h. The granulocytic differentiation of HL-60 cells was analyzed by FACS analysis using anti-CD11B and anti-CD14 antibodies. The percentage of CD11B-positive cells in the HL-60 cells is shown. Morphologies of transfected and ATRA-treated HL-60 cells were observed by Giemsa staining. The arrows represent differentiated HL-60 cells, and the graphs are presented to show the percentage of granulocytic differentiation. (F) Model of the mechanism of G9a-mediated repression of JAK2 transcription during leukemia cell differentiation.

