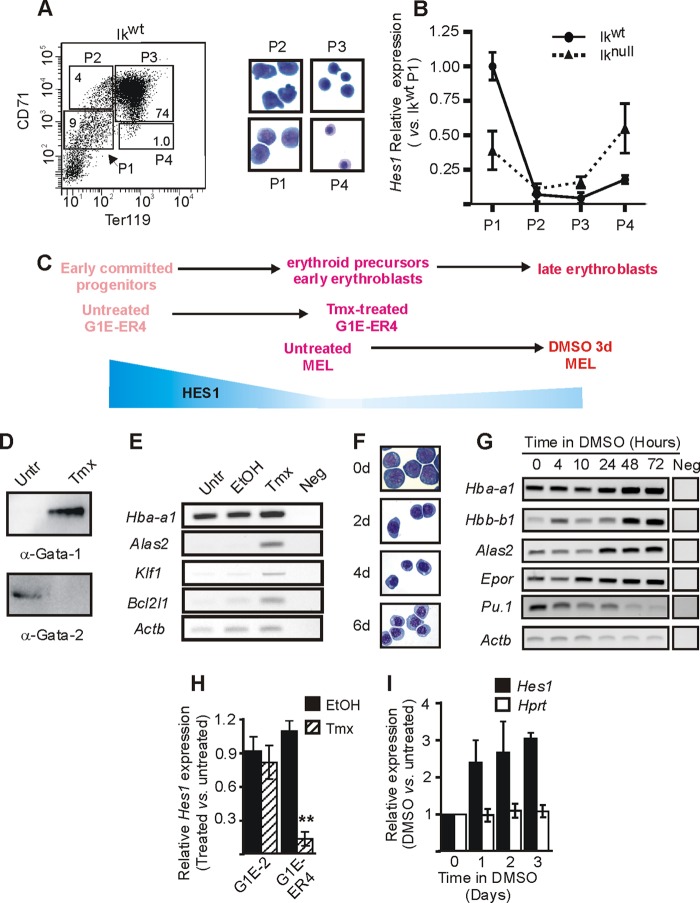
Fig 1.
Hes1 regulation during erythroid differentiation. (A and B) Ikaros wild-type (Ikwt) and Ikaros-null (Iknull) 14.5 dpc fetal livers were collected and sorted on the basis of Ter119 and CD71 expression levels. (A) (Left) FACS dot plot representation of the four sorted populations from Ikwt fetal livers. P1, CD71med Ter119neg/low; P2, CD71high Ter119neg/low; P3, CD71high Ter119high; P4, CD71med/Ter119high. (Right) Wright-Giemsa-staining of Cytospin preparations of sorted fetal liver cells. P1 is enriched in erythroid precursors (BFU-E and CFU-E), P2 is enriched in proerythroblasts and early basophilic erythroblasts, P3 is enriched in basophilic and chromatophilic erythroblasts, and P4 is enriched in orthochromatic erythroblasts (53). (B) Relative expression of Hes1 with standard deviations in each population. Relative expression was calculated according to Pfaffl (43) using Actb as the internal control. (C) Comparative schematic representation of erythroid cell differentiation in different model systems. A schematic view of Hes1 relative expression levels is in blue. (D, E, and H) Untreated (Untr), ethanol (EtOH)-treated or tamoxifen (Tmx)-treated G1E-ER4 cells were used for expression analyses. (D) Western blot analysis of GATA-1 and GATA-2 expression in nuclear protein extract. Antibodies used for the immunodetection are indicated under each panel. (E) Agarose gels presenting the semiquantitative mRNA expression analysis of Hba-a1, Alas2, Klf1, Bcl2l1, and Actb. Neg, semiquantitative RT-PCR performed without mRNA template. (H) Bar graph presenting the relative expression of the Hes1 gene measured by qRT-PCR. Standard deviations are indicated. Relative expression was calculated according to Pfaffl (43) using Actb as the internal control. (F, G, and I) Untreated (Untr) or DMSO-treated MEL cells were used for analyses. (F) Wright-Giemsa-staining of Cytospin preparations of cells induced with DMSO for 0, 2, 4, and 6 days (d). (G) Agarose gels presenting the semiquantitative mRNA expression analysis of the differentiation marker genes Hba-a1, Hbb-b1, Alas2, Epor, Spfi1 (Pu.1), and Actb (15, 30, 39). RT-PCR was performed on untreated cells or cells treated with DMSO for different times. Neg, RT-PCR performed without mRNA template. (I) Relative expression of Hes1 and Hprt (negative control) genes measured by qRT-PCR as a function of time in DMSO. Standard deviations are indicated. Relative expression was calculated according to Pfaffl (43) using Actb as the internal control.

