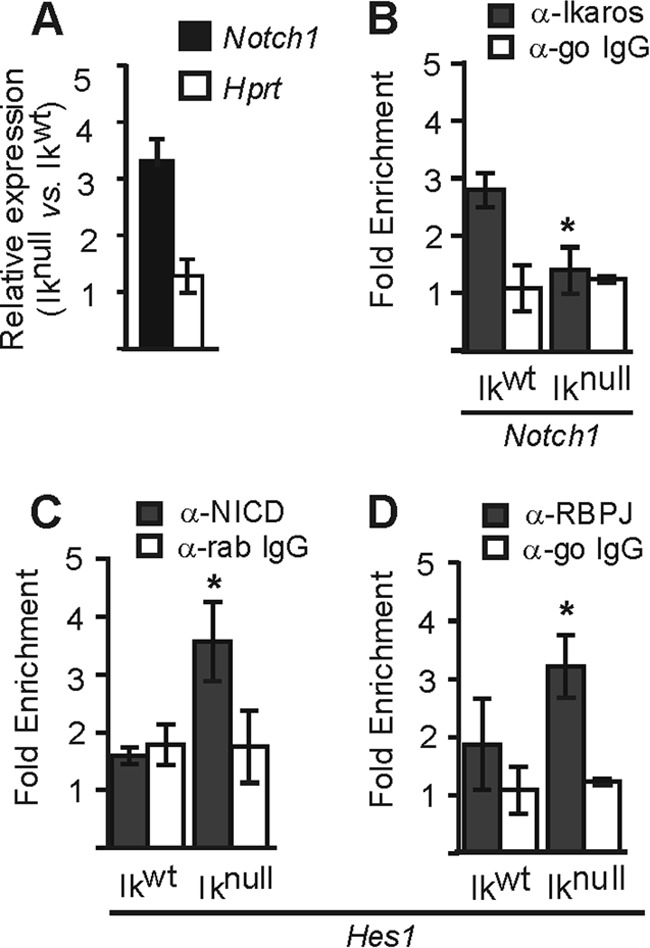
Fig 10.

Ikaros influence on Notch1 in EryC. (A) Relative expression of Notch1 in Iknull versus Ikwt EryC. Standard deviations are shown. The relative expressions were calculated according to Pfaffl (43), using Actb as the internal control. Hprt was the negative control. (B to D) Bar graphs of the recruitment of Ikaros (A), Notch intracellular domain (NICD) (B), or RBPJ (D) to the Notch1 (B) or Hes1 (C and D) promoter, expressed as fold enrichment with standard deviations. ChIP was performed with anti-Ikaros, anti-NICD, anti-RBPJ, or isotype-matched immunoglobulin G (go, goat; rab, rabbit) and analyzed by qPCR as described for Fig. 4. *, P < 0.05 (significant differences between values for Iknull and Ikwt cells according to Student's t test).
