Fig 3.

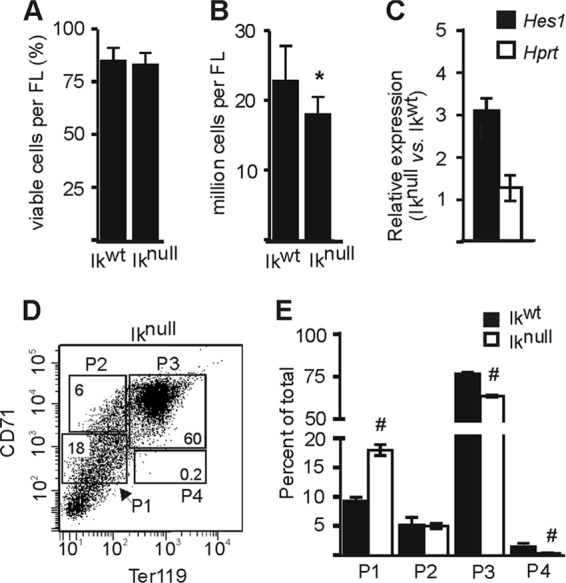
Ikaros involvement in erythroid differentiation and Hes1 regulation in 14.5 dpc fetal liver EryC. (A and B) Ikwt and Iknull total 14.5 dpc fetal liver cells (EryC) were subjected to a viable-cell count by trypan blue exclusion. These results were obtained from at least 15 fetal livers of each background. Bar graphs show the percentage of viable cells (A) or the number of viable cells (B) per fetal liver for each background with standard deviations. *, P < 0.001 (significant differences between the values for Iknull and Ikwt cells according to Student's t test). (C) Relative expression of Hes1 or Hprt (negative control) genes in Ikwt and Iknull total 14.5 dpc fetal liver cells with standard deviations. Relative expression was calculated according to Pfaffl (43) using Actb as the internal control. (D) FACS dot plot representation of the four sorted populations from Iknull fetal livers (populations are described in the legend to Fig. 1A). (E) Percentages of cells in each sorted population of Ikwt and Iknull cells. #, P < 0.05 (significant difference between the values for Iknull and Ikwt cells according to Student's t test).
