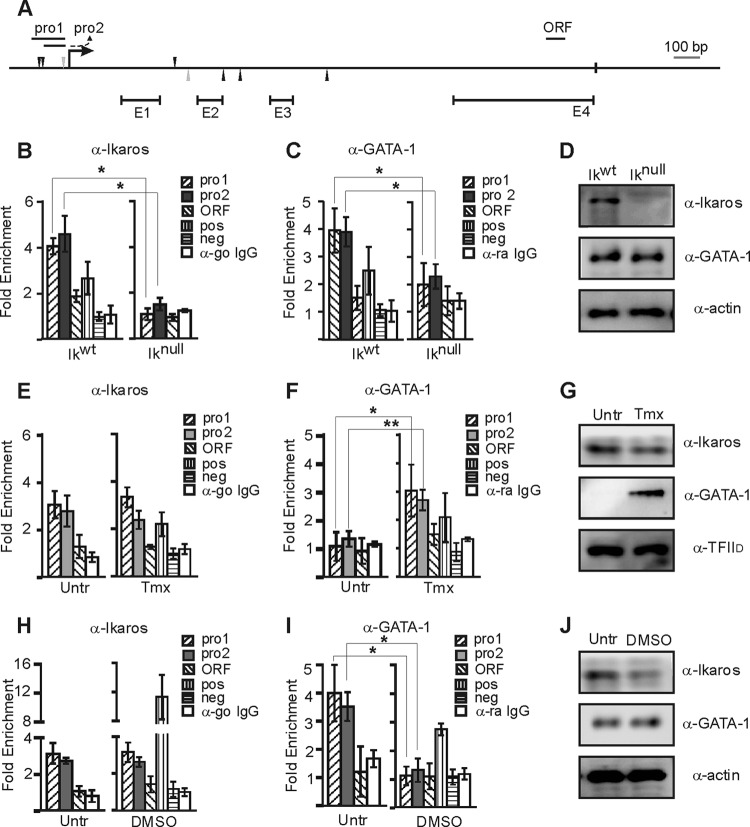
Fig 4.
Ikaros and GATA-1 recruitment to the Hes1 promoter in EryC. (A) Schematic representation of Hes1 gene. Potential Ikaros (black triangles) and GATA-1 (gray triangles) binding sites, the transcription start site (arrow), the stop codon (black box), exons (E), and amplicons used for ChIP (pro1, pro2, and ORF) are indicated. (B to J) EryC were collected for ChIP and Western blot analyses, including Ikwt or Iknull total fetal livers (B to D), untreated (Untr) or tamoxifen (Tmx)-treated G1E-ER4 cells (E to G), and untreated (Untr) MEL cells or MEL cells treated with DMSO for 3 days (DMSO) (H to J). Bar graphs present the relative recruitment of Ikaros (B, E, and H) or GATA-1 (C, F, and I) to the Hes1 promoter, expressed as fold enrichment with standard deviations. ChIP was performed with anti-Ikaros (α-Ikaros) or α-GATA-1 and analyzed by qPCR. Fold enrichments were calculated with the 2−ΔΔCT formula, where the Thp (Tamm-Horsfall protein) promoter was the internal control. Hes1 was amplified with three different primer sets as described for panel A; regions amplified for the positive control (pos) were β-globin HS2 (α-GATA-1) and 1G enhancer of Gata2 (α-Ikaros), and the negative control (neg) was the Amy promoter. ChIP was also performed with isotype-matched immunoglobulin G (go, goat; ra, rat) and analyzed by qPCR with pro2 primer set. *, P < 0.05 (significant differences between the values for Iknull and Ikwt cells, untreated and Tmx-treated cells, and untreated and DMSO-treated cells according to Student's t test). (D, G, and J) Western blot analyses of GATA-1, Ikaros, and actin (control) expression in whole-cell extracts or nuclear extracts for G1E-ER4 cells using TFIID as a control (G). The antibodies used for the immunodetections are indicated.

