Fig 5.
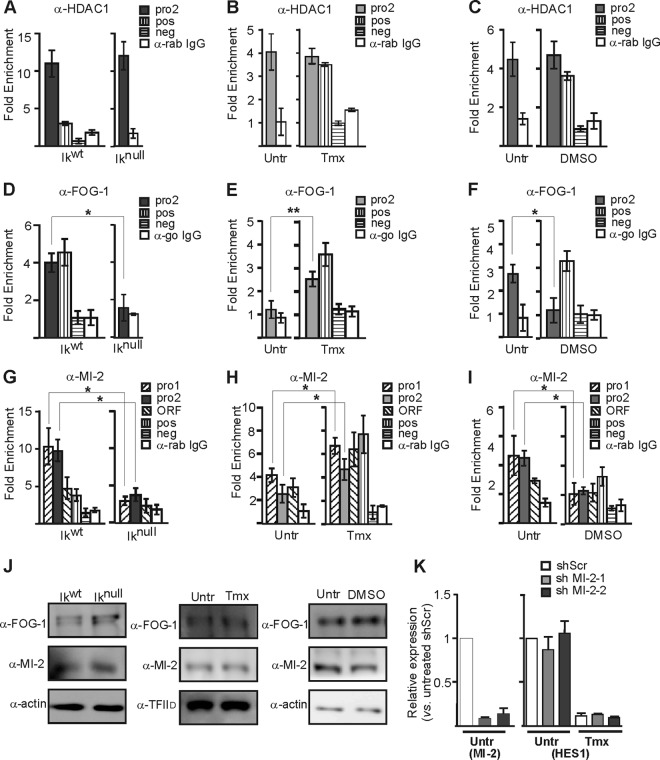
Cofactor recruitment to the Hes1 promoter in EryC. EryC were collected for ChIP and Western blot analyses: Ikwt or Iknull total fetal livers (A, D, G, and J), untreated (Untr) or tamoxifen (Tmx)-treated G1E-ER4 cells (B, E, H, and J), and untreated (Untr) MEL cells or MEL cells treated with DMSO for 3 days (DMSO) (C, F, I, and J). Bar graphs present the relative recruitment of HDAC1 (A to C), FOG-1 (D to F), or MI-2 (G to I) to the Hes1 promoter, expressed as fold enrichment with standard deviations. ChIP was performed with anti-HDAC1, anti-FOG-1, anti-MI-2, or isotype-matched immunoglobulin G (go, goat; rab, rabbit) and analyzed by qPCR as described for Fig. 4. Regions amplified as positive controls (pos) were the −2.8 enhancer of Gata2 (anti-HDAC1 and anti-MI-2) and β-globin HS2 (anti-FOG-1), and the negative control (neg) was the Amy promoter. *, P < 0.05; **, P < 0.01 (significant differences between values for Iknull and Ikwt cells, untreated and Tmx-treated cells, and untreated and DMSO-treated cells according to Student's t test). (J) Western blots of FOG-1, MI-2, and actin (control) expression in whole-cell extracts or in nuclear extracts for G1E-ER4 cells using TFIID as a control. (K) G1E-ER4 cells were stably transfected with vectors expressing shRNA directed against Mi-2 mRNA (shMI-2-1 or shMI-2-2) or with a nonspecific scrambled shRNA (shScr). shMI-2-1 and shMI2-2 express, respectively, 9% and 15% of the normal MI-2 expression level in Tmx-treated G1E-ER4 cells. Relative expression of Mi-2 or Hes1 in cells with shScr, shMI-2-1, or shMI-2-2 was measured by RT-qPCR in untreated (Untr) or tamoxifen (Tmx)-treated cells. Standard deviations are indicated. The relative expression was calculated according to Pfaffl (43) using Actb as an internal control.

