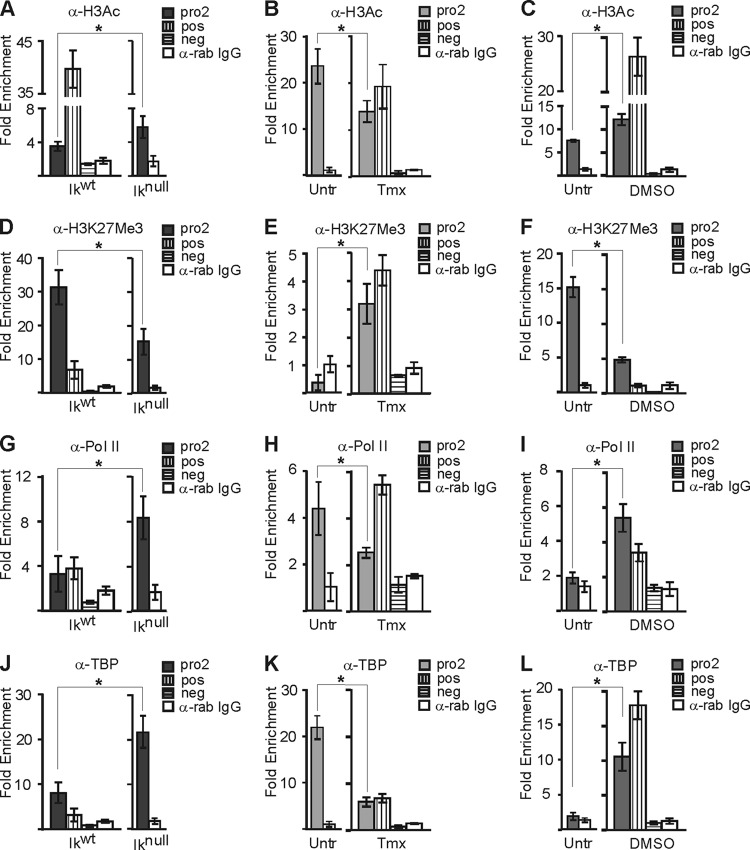
Fig 6.
Histone posttranslational modifications and PIC assembly on the Hes1 promoter in EryC. EryC were collected for ChIP analysis: Ikwt or Iknull total fetal livers (A, D, G, and J), untreated (Untr) or tamoxifen (Tmx)-treated G1E-ER4 cells (B, E, H, and K), and untreated (Untr) MEL cells or MEL cells treated with DMSO for 3 days (DMSO) (C, F, I, and L). Bar graphs present the relative recruitment of acetylated H3 (H3Ac) (A to C), trimethylated lysine 27 of H3 (H3K27me3) (D to F), Pol II (G to I), or TBP (J to L) to the Hes1 promoter, expressed as fold enrichment with standard deviations. ChIP was performed with anti-H3Ac, anti-H3K27me3, anti-Pol II, anti-TBP, or isotype-matched immunoglobulin G (rab, rabbit) and analyzed by qPCR as described for Fig. 4. Regions amplified for positive control (pos) were β-globin HS2 (anti-H3Ac), −2.8 enhancer of Gata2 (anti-H3K27Me3), and βmaj (anti-Pol II and anti-TBP), and the negative control (neg) was the Amy promoter (anti-H3Ac, anti-Pol II, and anti-TBP) and βmaj (anti-H3K27Me3). *, P < 0.05 (significant differences between values for Iknull and Ikwt cells, untreated and Tmx-treated cells, and untreated versus DMSO-treated cells, according to Student's t test).

