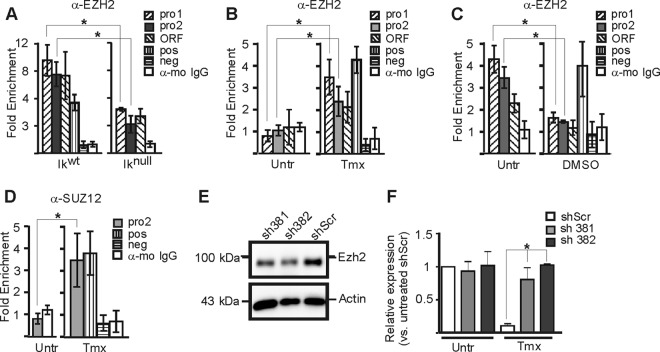
Fig 7.
PRC2 influence on the Hes1 promoter repression in EryC. (A to D) EryC were collected for ChIP analysis: Ikwt or Iknull total fetal livers (A), untreated (Untr) or tamoxifen (Tmx)-treated G1E-ER4 cells (B and D), and untreated (Untr) MEL cells or MEL cells treated with DMSO for 3 days (DMSO) (C). Bar graphs present the recruitment of EZH2 (A to C) or SUZ12 (D) to the Hes1 promoter, expressed as fold enrichment with standard deviations. ChIP was performed with anti-EZH2, anti-SUZ12, or isotype-matched immunoglobulin G (mo, mouse) and analyzed by qPCR as described for Fig. 4. The region amplified as a positive control (pos) was the −2.8 enhancer of Gata2 (anti-EZH2 and anti-SUZ12), and the negative control (neg) was NM_026543 (anti-EZH2, anti-SUZ12) (64). *, P < 0.05 (significant differences between values for Iknull and Ikwt cells, untreated versus Tmx-treated cells, or untreated [−] and DMSO, according to Student's t test) (E) Western blot analysis of EZH2 knockdown in G1E-ER4. The anti-EZH2 and antiactin (control) antibodies were used for immunodetection. sh381 and sh382 are shRNAs against EZH2 mRNA; shScr is a nonspecific scrambled shRNA. (F) Relative expression of Hes1 in G1E-ER4 cells with sh381, sh382, or shScr. *, P < 0.05 (significant differences between G1E-ER4 shScr Hes1 expression and that of G1E-ER4 sh381 and G1E-ER4 sh382). Standard deviations are indicated.

