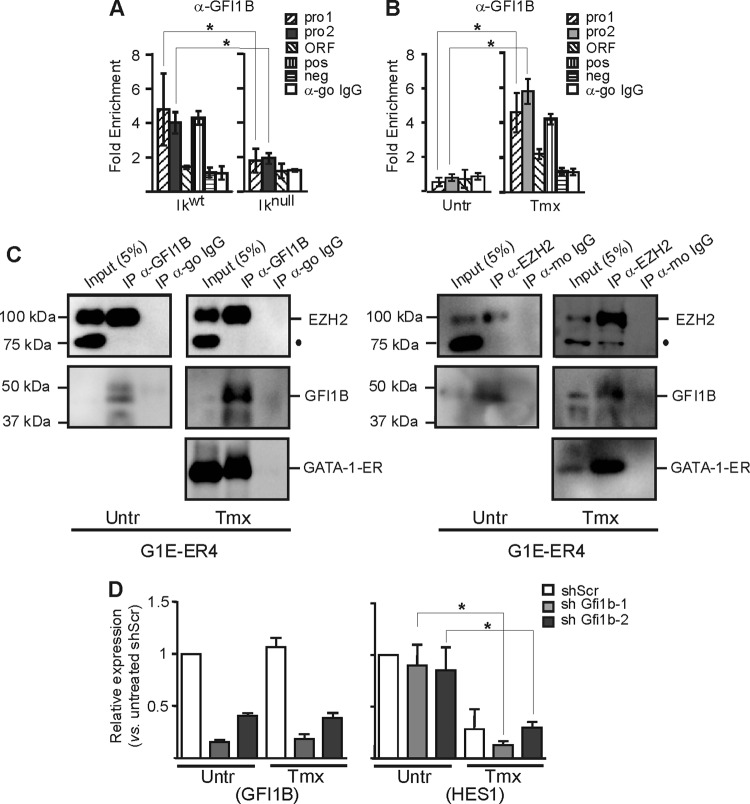
Fig 9.
GFI1B influence in the Hes1 promoter regulation in EryC. (A to C) EryC were collected for ChIP and Western blot analysis: Ikwt or Iknull total fetal livers (A) and untreated (Untr) or tamoxifen (Tmx)-treated G1E-ER4 cells (B and C). Bar graphs show the recruitment of GFI1B (A and B) to the Hes1 promoter, expressed as fold enrichment with standard deviations. ChIP was performed with anti-GFI1B or isotype-matched immunoglobulin G (go, goat) and analyzed by qPCR as described for Fig. 4. The region amplified for positive control (pos) was the Gfi1b promoter, and the negative control (neg) was the Car1 promoter (48). *, P < 0.05 (significant differences between values for Iknull and Ikwt cells or untreated versus Tmx-treated cells according to Student's t test). (D) G1E-ER4 cells were stably transfected with vectors expressing shRNA directed against Gfi1b mRNA (shGFI1B-1 or shGFI1B-2) or with a nonspecific scrambled shRNA (shScr). Compared with the normal Gfi1b expression levels detected in untreated or Tmx-treated G1E-ER4 cells, the expression of Gfi1b is significantly downregulated in the shGFI1B-1 and shGFI1B-2 stable populations of G1E-ER4 cells. Relative expression of Gfi1b or Hes1 in cells with shScr, shGfi1b-1, or shGfi1b-2 was measured by qRT-PCR in untreated (Untr) or tamoxifen (Tmx)-treated cells. Standard deviations are indicated. Relative expression was calculated according to Pfaffl (43) using Actb as an internal control.

