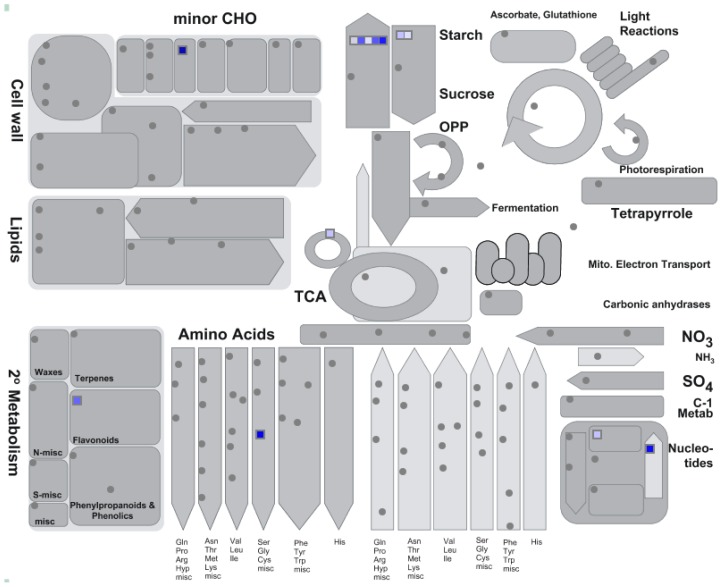
Figure 4.
Co-expression analysis of plastidic GS. An overview of general metabolism was created using MapMan. Blue squares represent genes that are positively co-expressed (Pearson distance <0.3) with plastidic GS. The intensity of the blue color is proportional to the degree of correlation between a certain gene and the plastidic GS gene.

