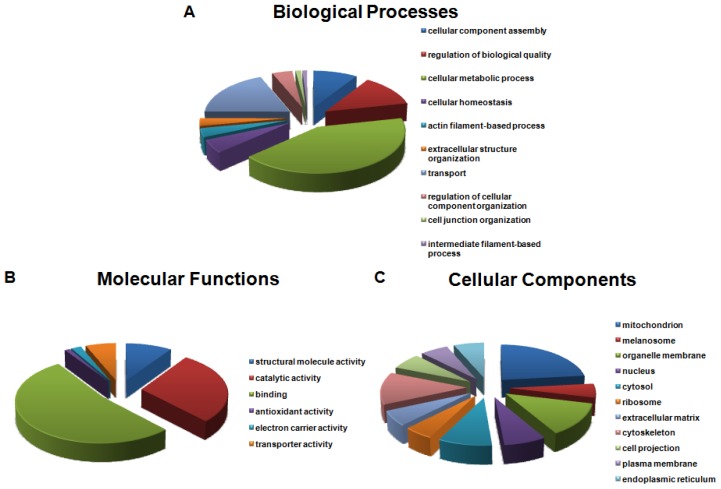
Figure 4.
Gene Ontology (GO) analysis of the OC proteome with The Database for Annotation, Visualization and Integrated Discovery (DAVID) v6.7. Overrepresented categories with p-value < 0.05 were shown in each type. The area of a sector is proportional to the number of genes in the OC proteome annotated to the corresponding GO category. (A) Biological processes; (B) Molecular functions; (C) Cellular components.

