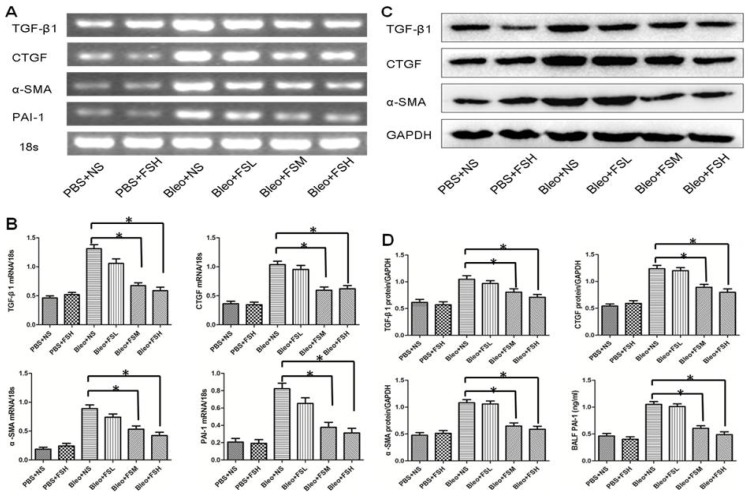
Figure 4.
The levels of TGF-β1, CTGF, α-SMA and PAI-1 mRNA expression and protein in the lung on day 21 after bleomycin administration. The mRNA expression was examined in lung tissue by semi quantitative RT-PCR, protein level of TGF-β1, CTGF and α-SMA by Western blotting, while the level of PAI-1 protein in BALF was measured by ELISA. Results are expressed as means ± SEM (n = 6). Statistical analysis was performed using one-way ANOVA followed by Tukey’s multiple comparison test (* p < 0.05).

