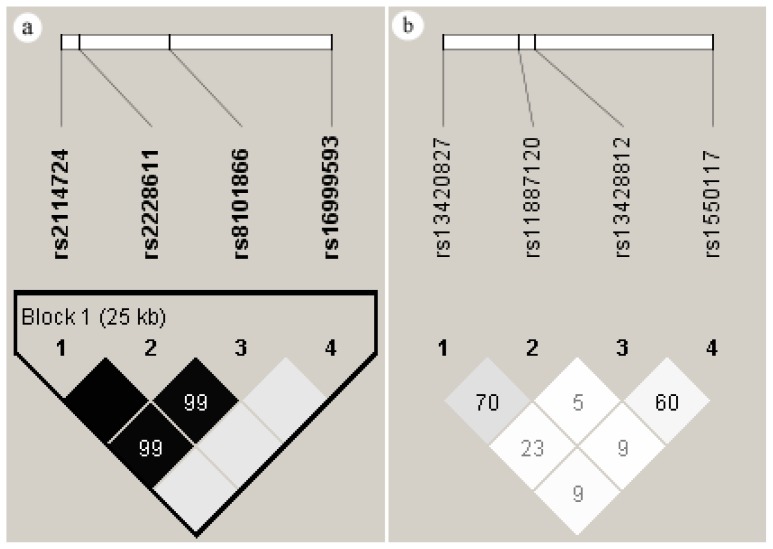
Figure 1.
Linkage disequilibrium (LD) pattern of DNMT1 (a) and DNMT3A (b) SNPs by Haploview analysis. Numbers inside the boxes represent r2 values for LD, and miss numbers were 100. Shaded regions in the LD plot indicate the strength of LD between pair wise combinations of SNPs (white, low LD; black, high LD).

