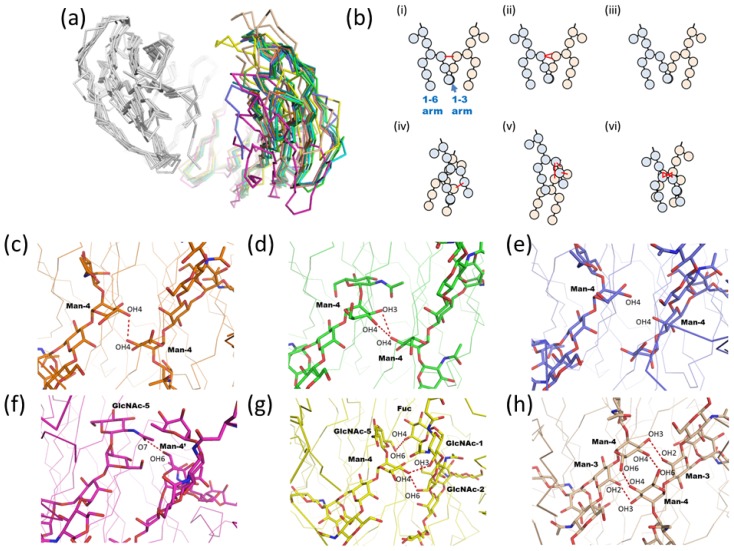
Figure 5.
(a) Structural superposition of 10 Fc fragment structures (1fc1; green, 1h3v; cyan, 1h3y; magenta, 1i1c; yellow, 2dts; pink, 1i1c; yellow, 2rgs; wheat, 2vuo; slate, 3ave; orange, 3do3; lime, 3fjt; deep teal). For four entries (PDB code; 1h3w, 3c2s, 2ql1, and 1l6x), the asymmetric units of these crystals contain only one heavy chain. Thus, the symmetry-related neighboring heavy chains were compensated for in this analysis. Structural superposition was performed by SUPERPOSE. (b) Schematic representation of six types of carbohydrate-carbohydrate interaction modes. N-glycans of two chains are shown in blue and pink. Hydrogen bonds are shown as red lines. (c)–(h) Close-up views of the interfaces of carbohydrate-carbohydrate interactions. Carbohydrate moiety is shown in the rod model. Hydrogen bonds between carbohydrates are shown as red dotted lines. The structural superimposition of four structures which have only one carbohydrate-carbohydrate interaction is shown in (c). Human IgG1 Fc fragment (PDB code; 1fc1) is shown in (d). The superimposition of two structures which have no interaction between glycans is shown in (e). Human IgG1 Fc in high salt condition (PDB code; 1h3y), rat IgG2a (PDB code; 1i1c), and mouse IgG2b Fc fragment (PDB code; 2rgs) are shown in (f), (g), and (h), respectively.

