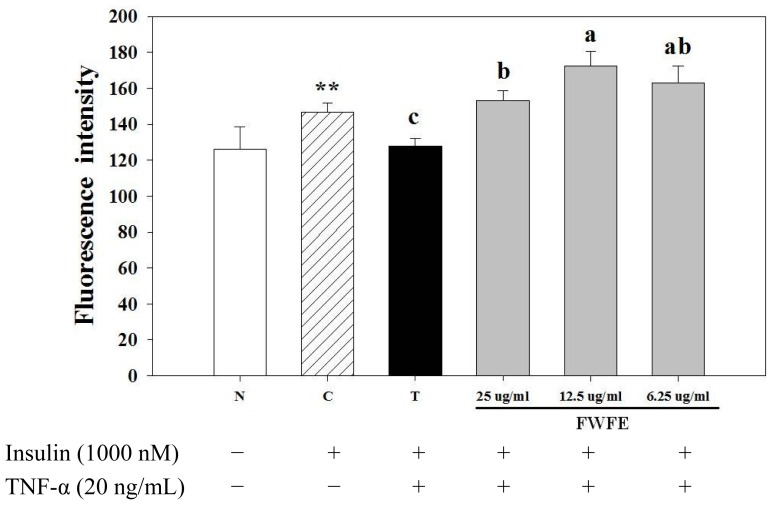
Figure 2.
Effects of FWFE on glucose uptake in TNF-α-treated FL83B mouse hepatocytes. ** significantly different (p < 0.01) from N (normal) group. Letters a,b indicate significant differences at 5% level. N: normal group, cells incubated with F-12K medium. C: control group, cells incubated with F-12K medium containing 1000 nM insulin. T: treated group, TNF-α-induced insulin resistant cells.

