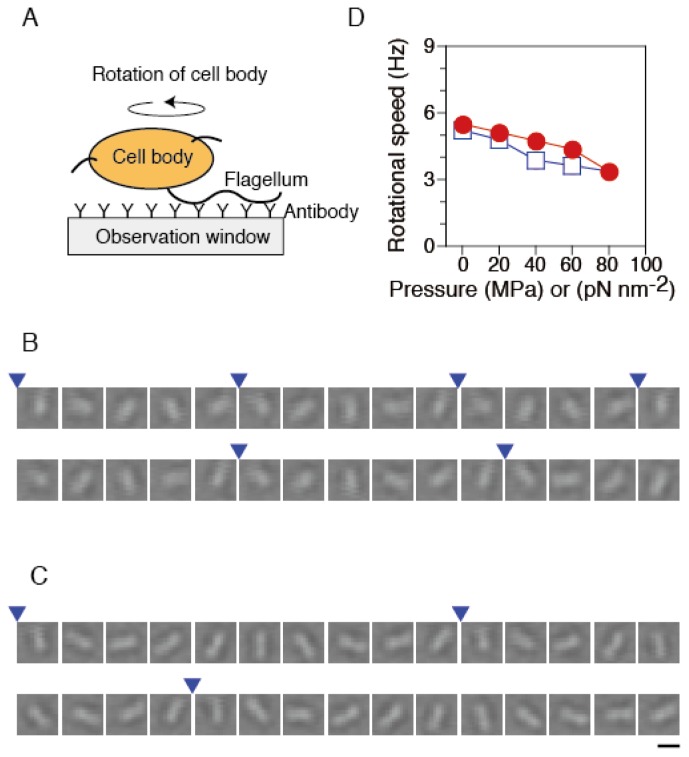
Figure 3.
Rotational speed of single flagellar motors. (A) Schematic drawing of the experimental system (not to scale). (B and C) Sequential bright-field images of the same rotating tethered cell at 33 ms intervals at 0.1 MPa (B) and 80 MPa (C). The images are displayed after processing contrast enhancement and brightness offset. Blue arrowheads indicate completion of a turn. Scale bar, 2 μm. (D) The plots are mean values (n = 52) of the rotational speed in the pressurization (circles) and depressurization processes (diamonds). Each speed was obtained from the rotation number during 10 s. Data for the motors that were in the stop state were excluded from calculations of the speed.

